
National Real Estate Insights & Trends | January 2024

Compass National Real Estate Insights, January 2024

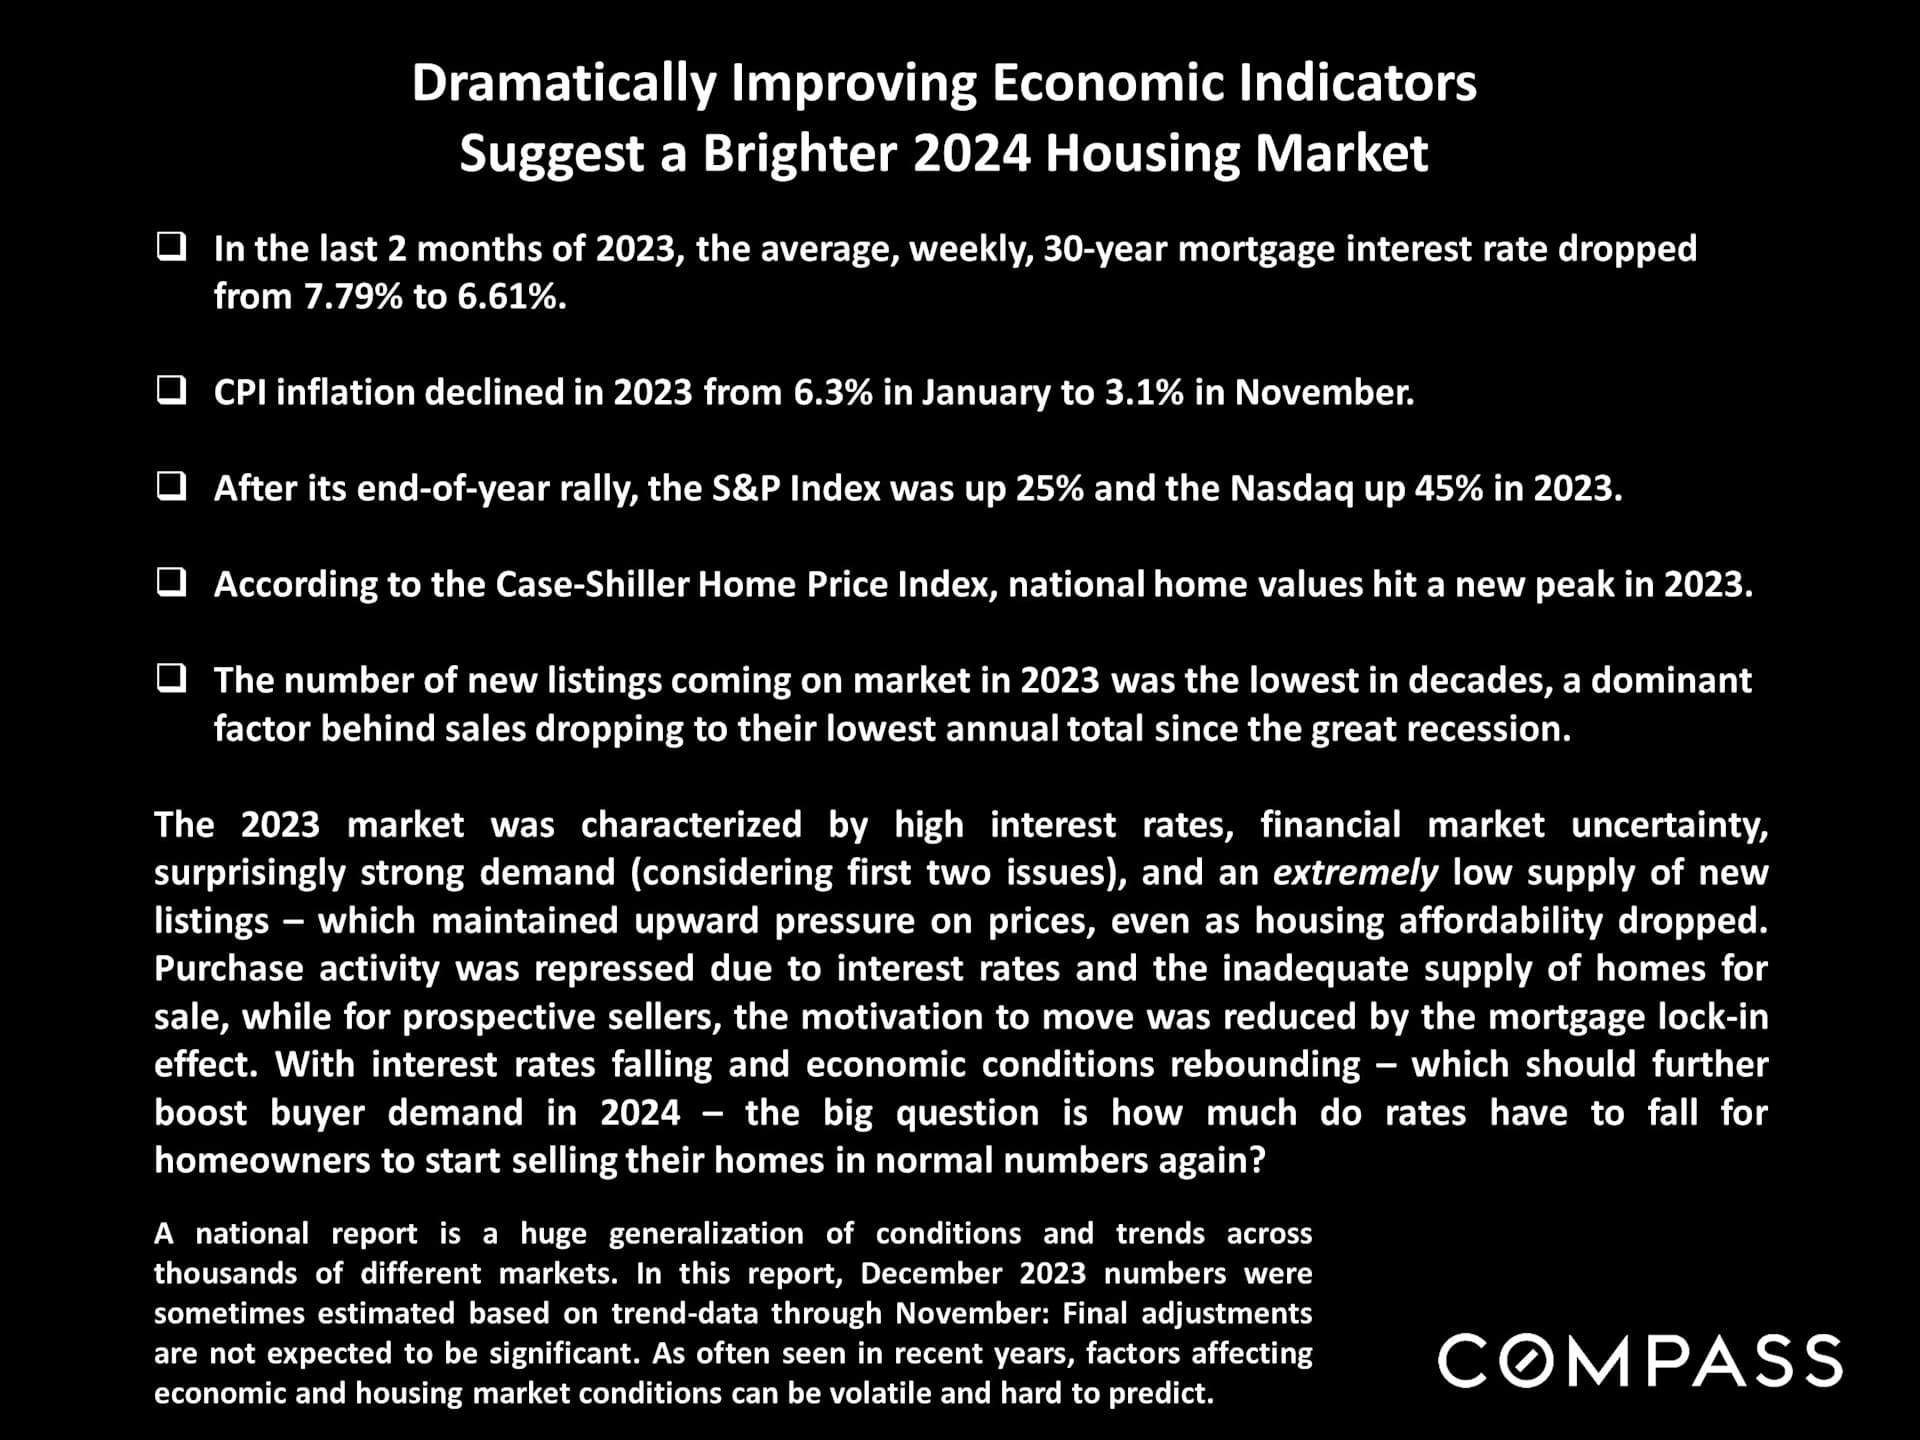
Infographic summarizing economic indicators and national housing market trends entering 2024.

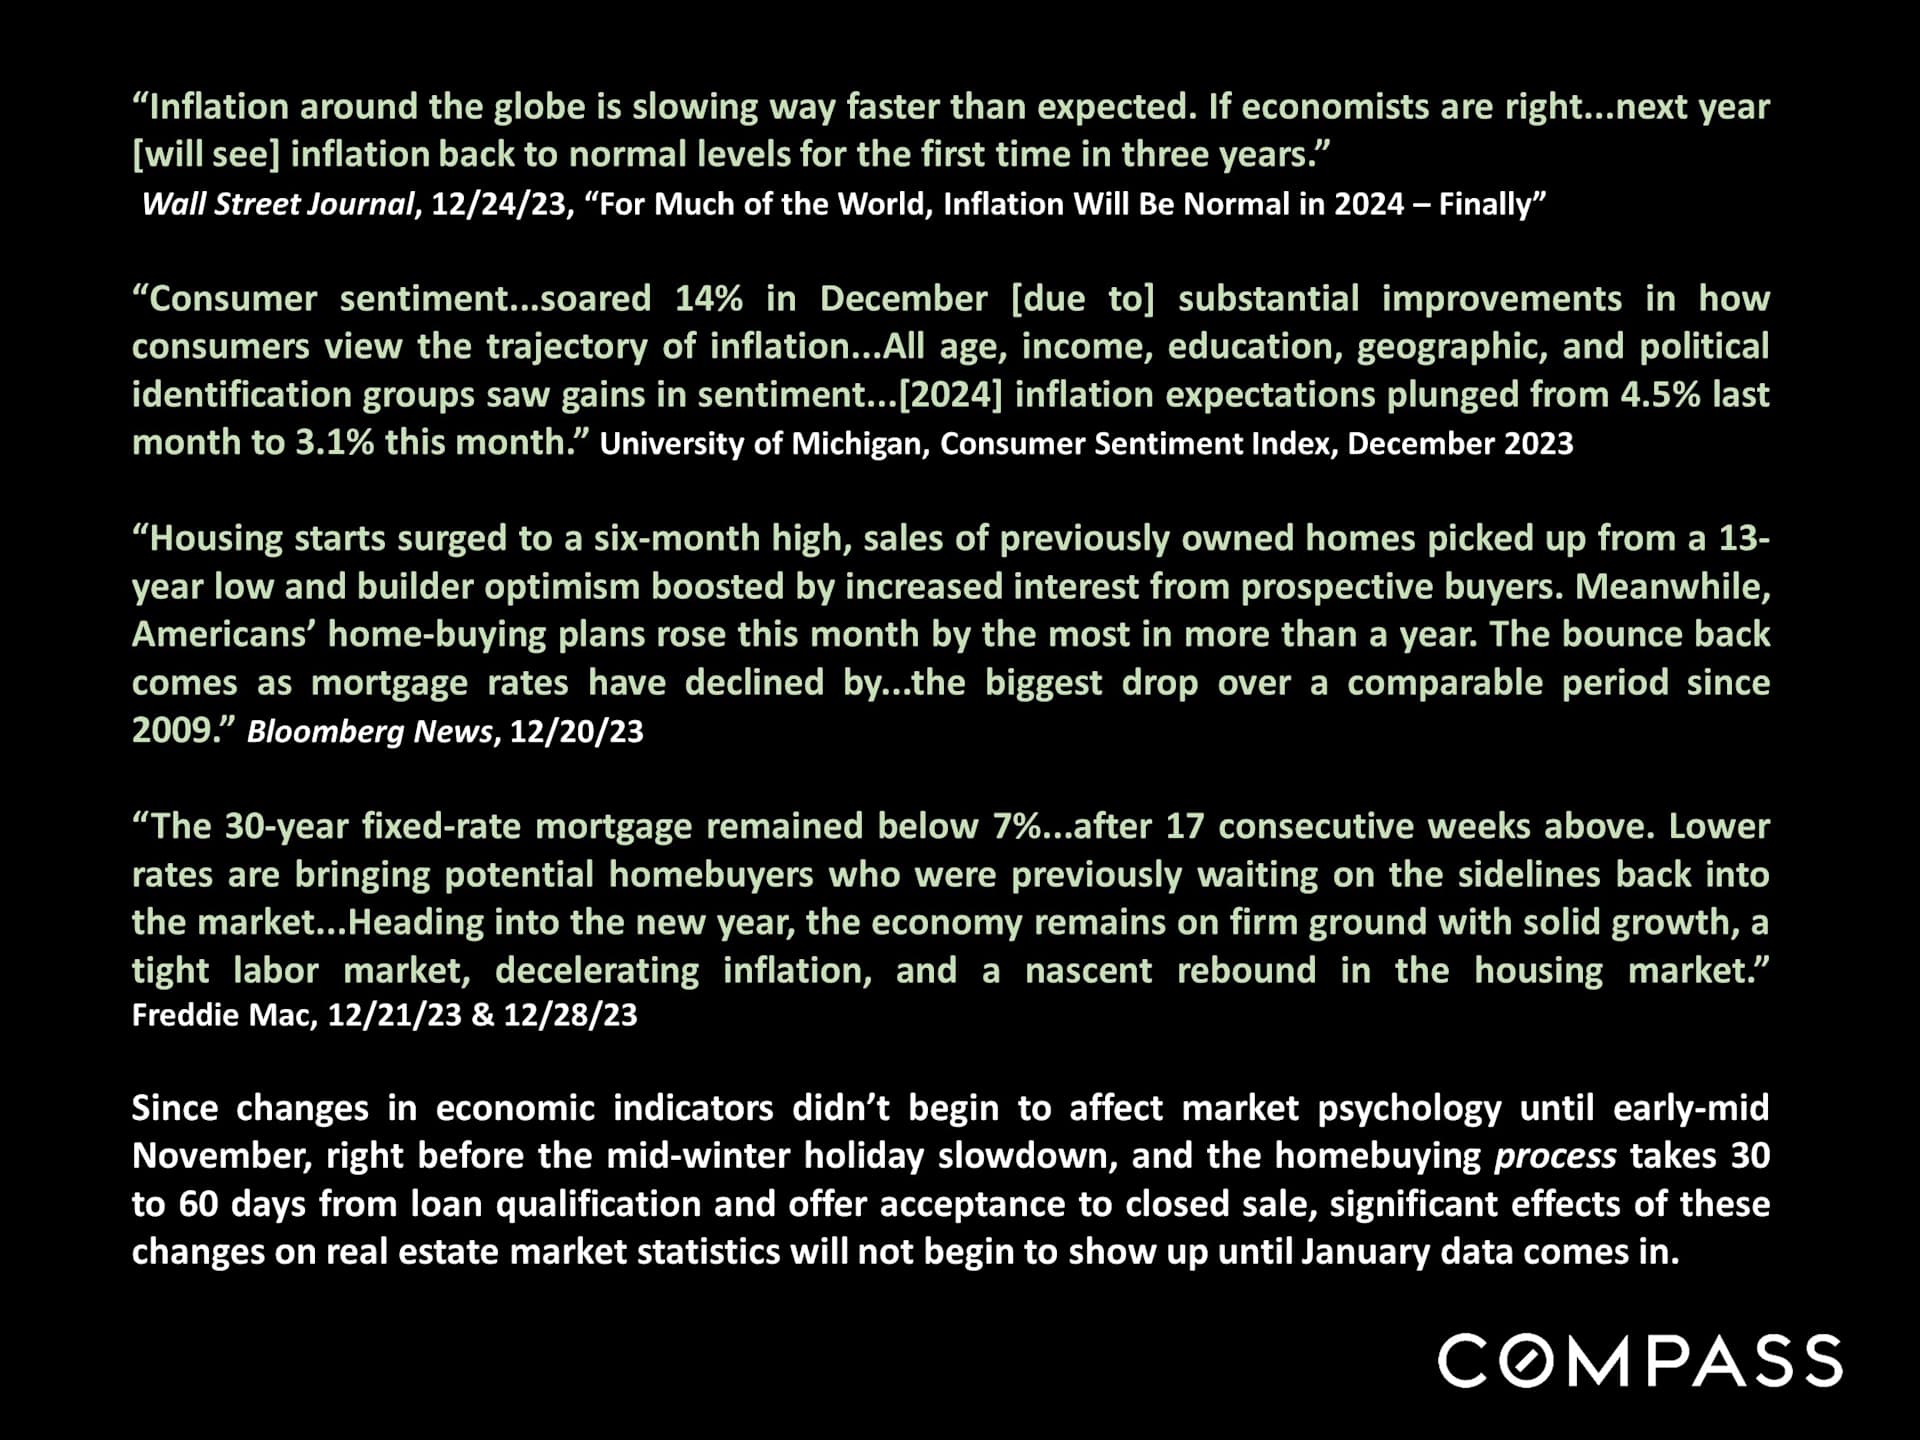
National real estate and economic insights for January 2024, with market quotes and a note on delayed effects in housing statistics.

Interest rates have plunged since October,

and are currently expected to drop further in 2024.
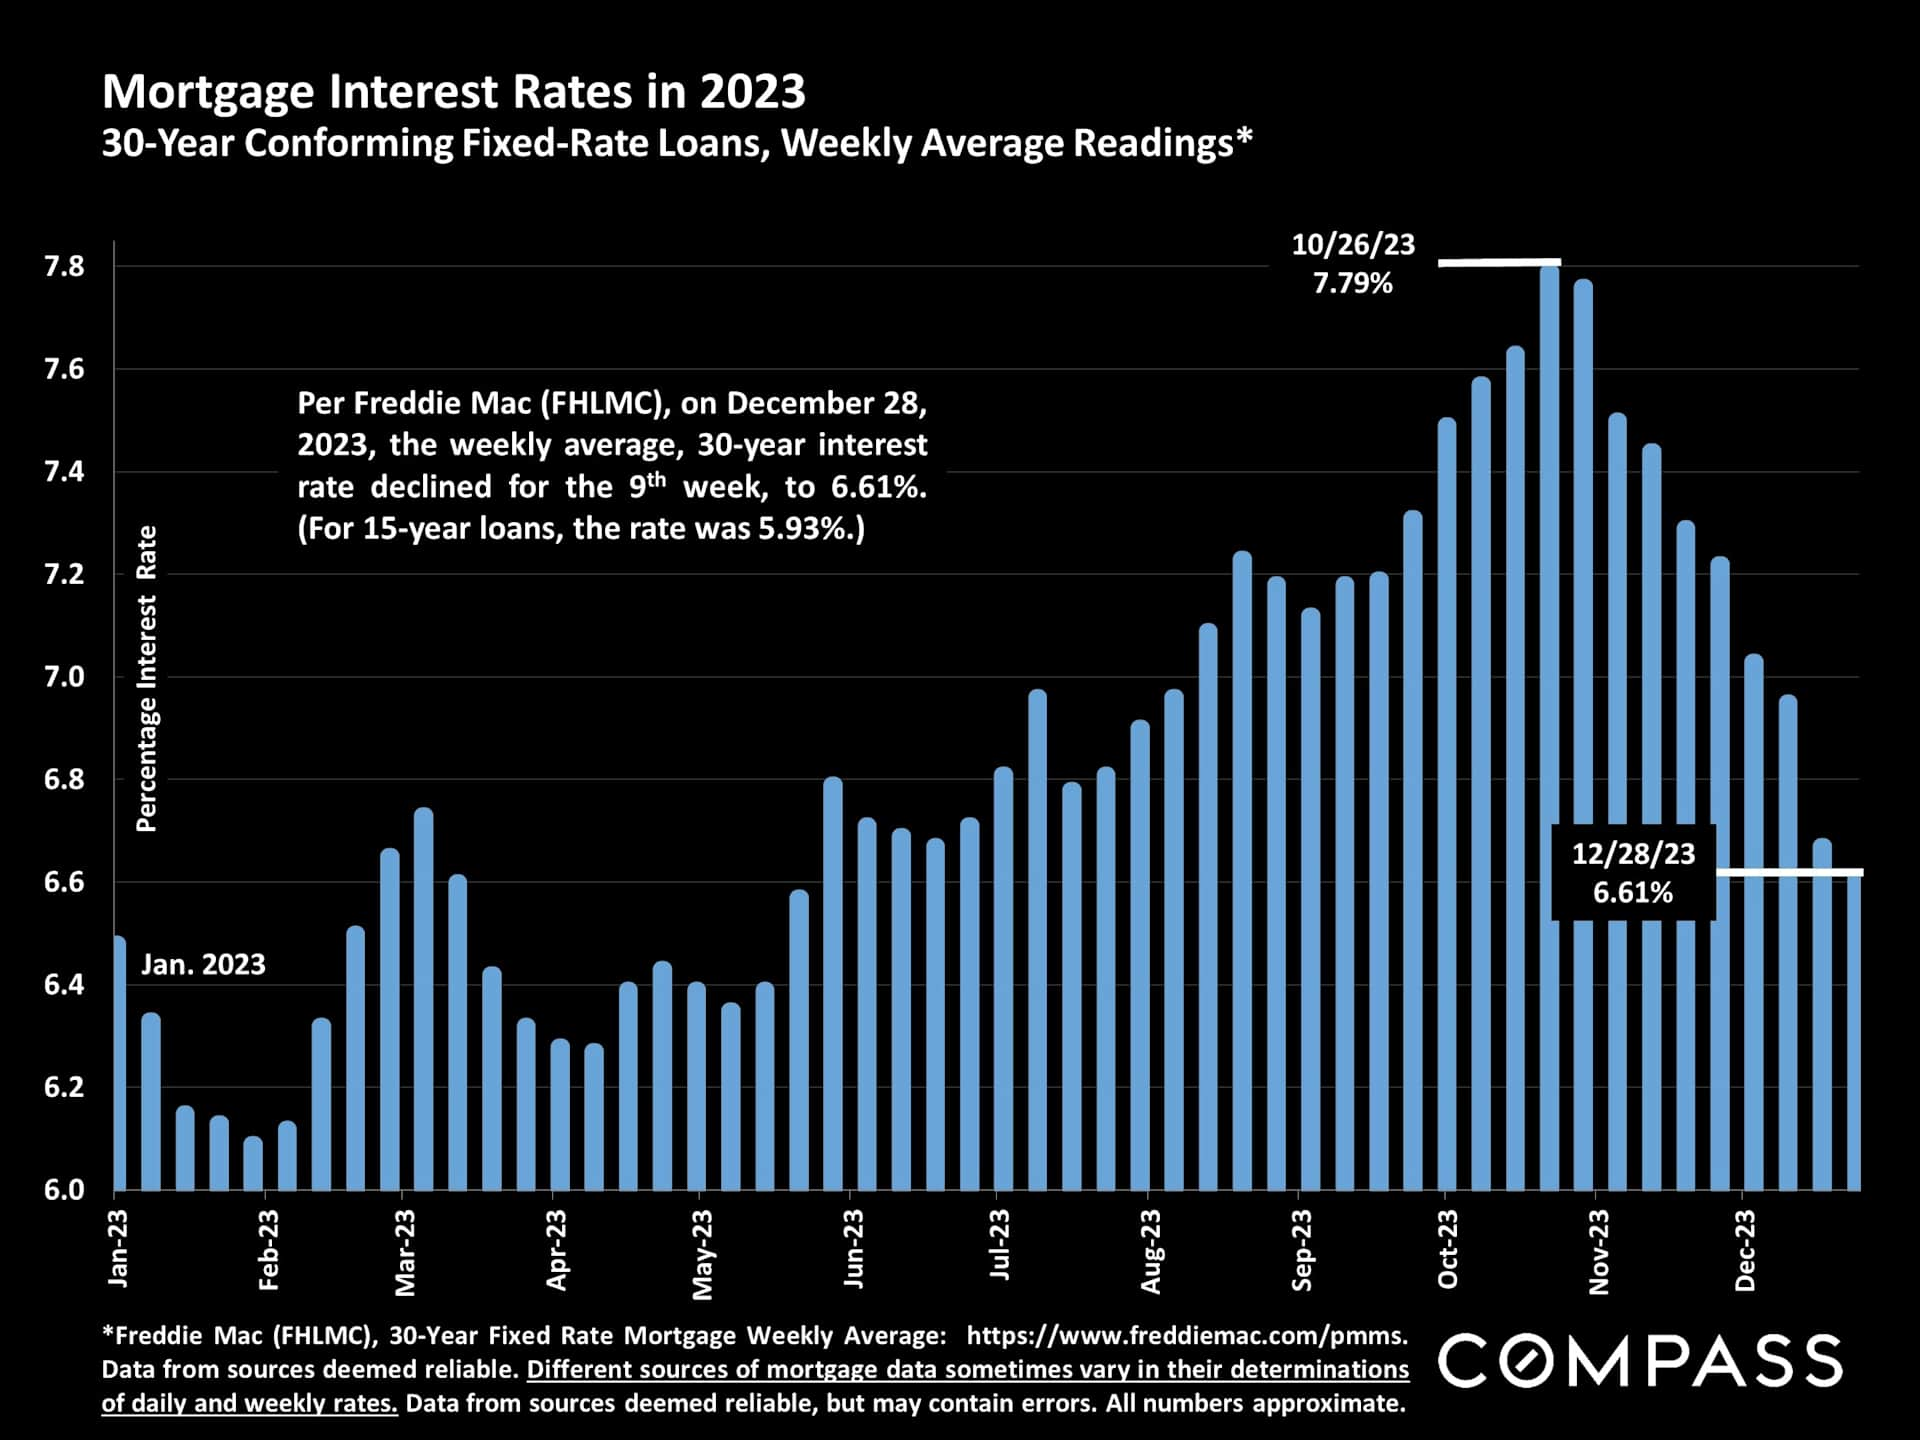
Chart of 2023 mortgage rates, peaking at 7.79% in October and declining to 6.61% by December.

Inflation is a huge factor in interest rates, consumer confidence, and housing and financial markets. Most analysts believe inflation will continue to fall in 2024.
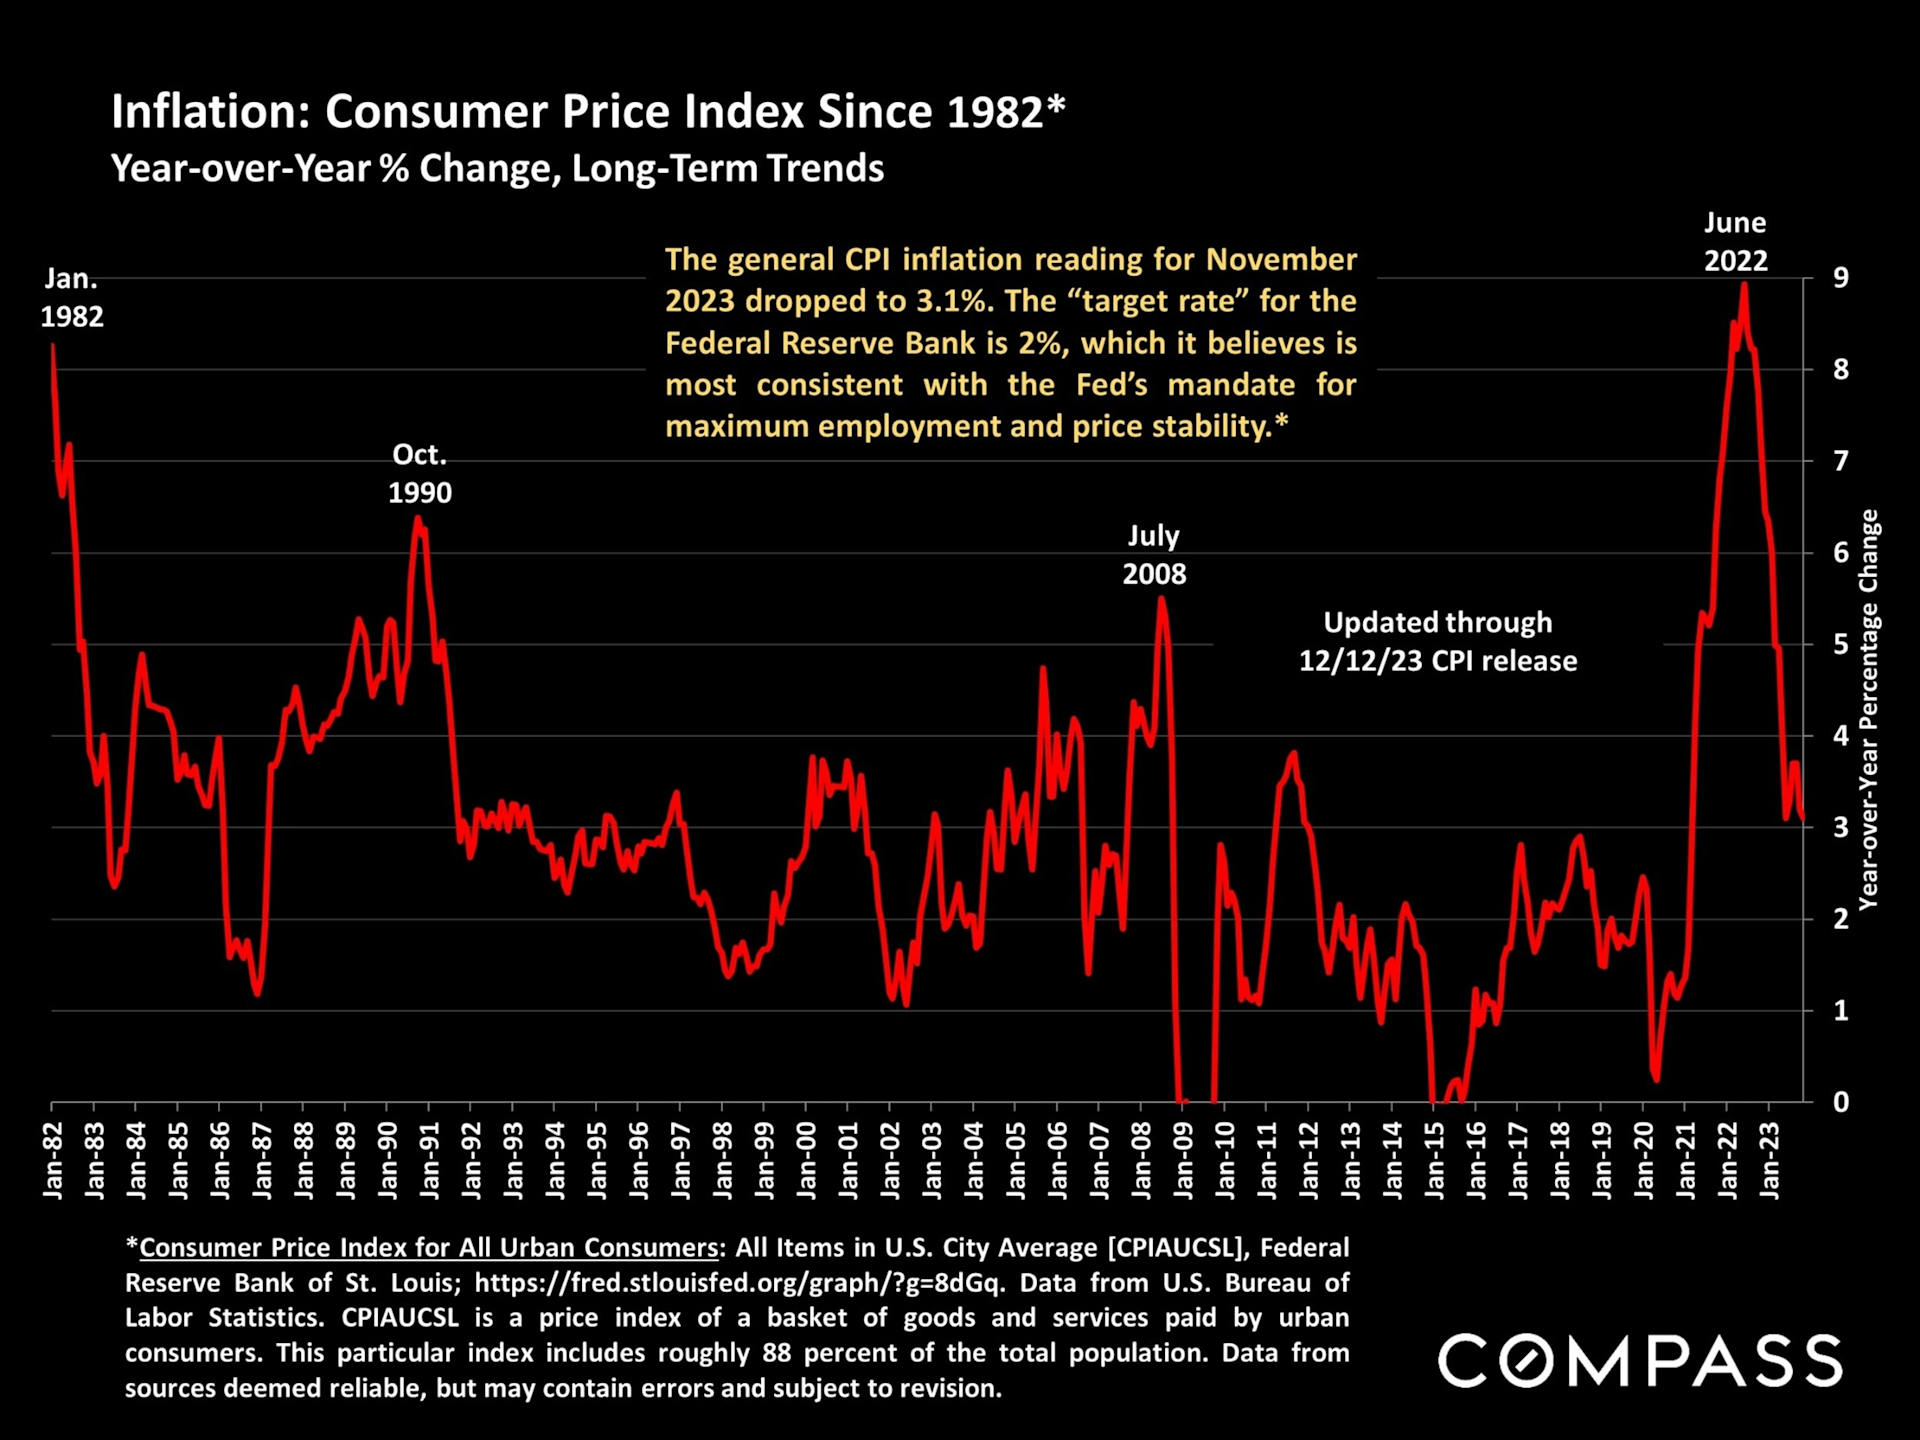
Chart of U.S. year-over-year CPI inflation from 1982 to 2023, with a sharp peak in 2022 and a 3.1% November 2023 reading.

Consensus opinion is that the Fed will soon begin to drop its benchmark rate. Once it determines a change is appropriate, the Fed often acts quickly and decisively.
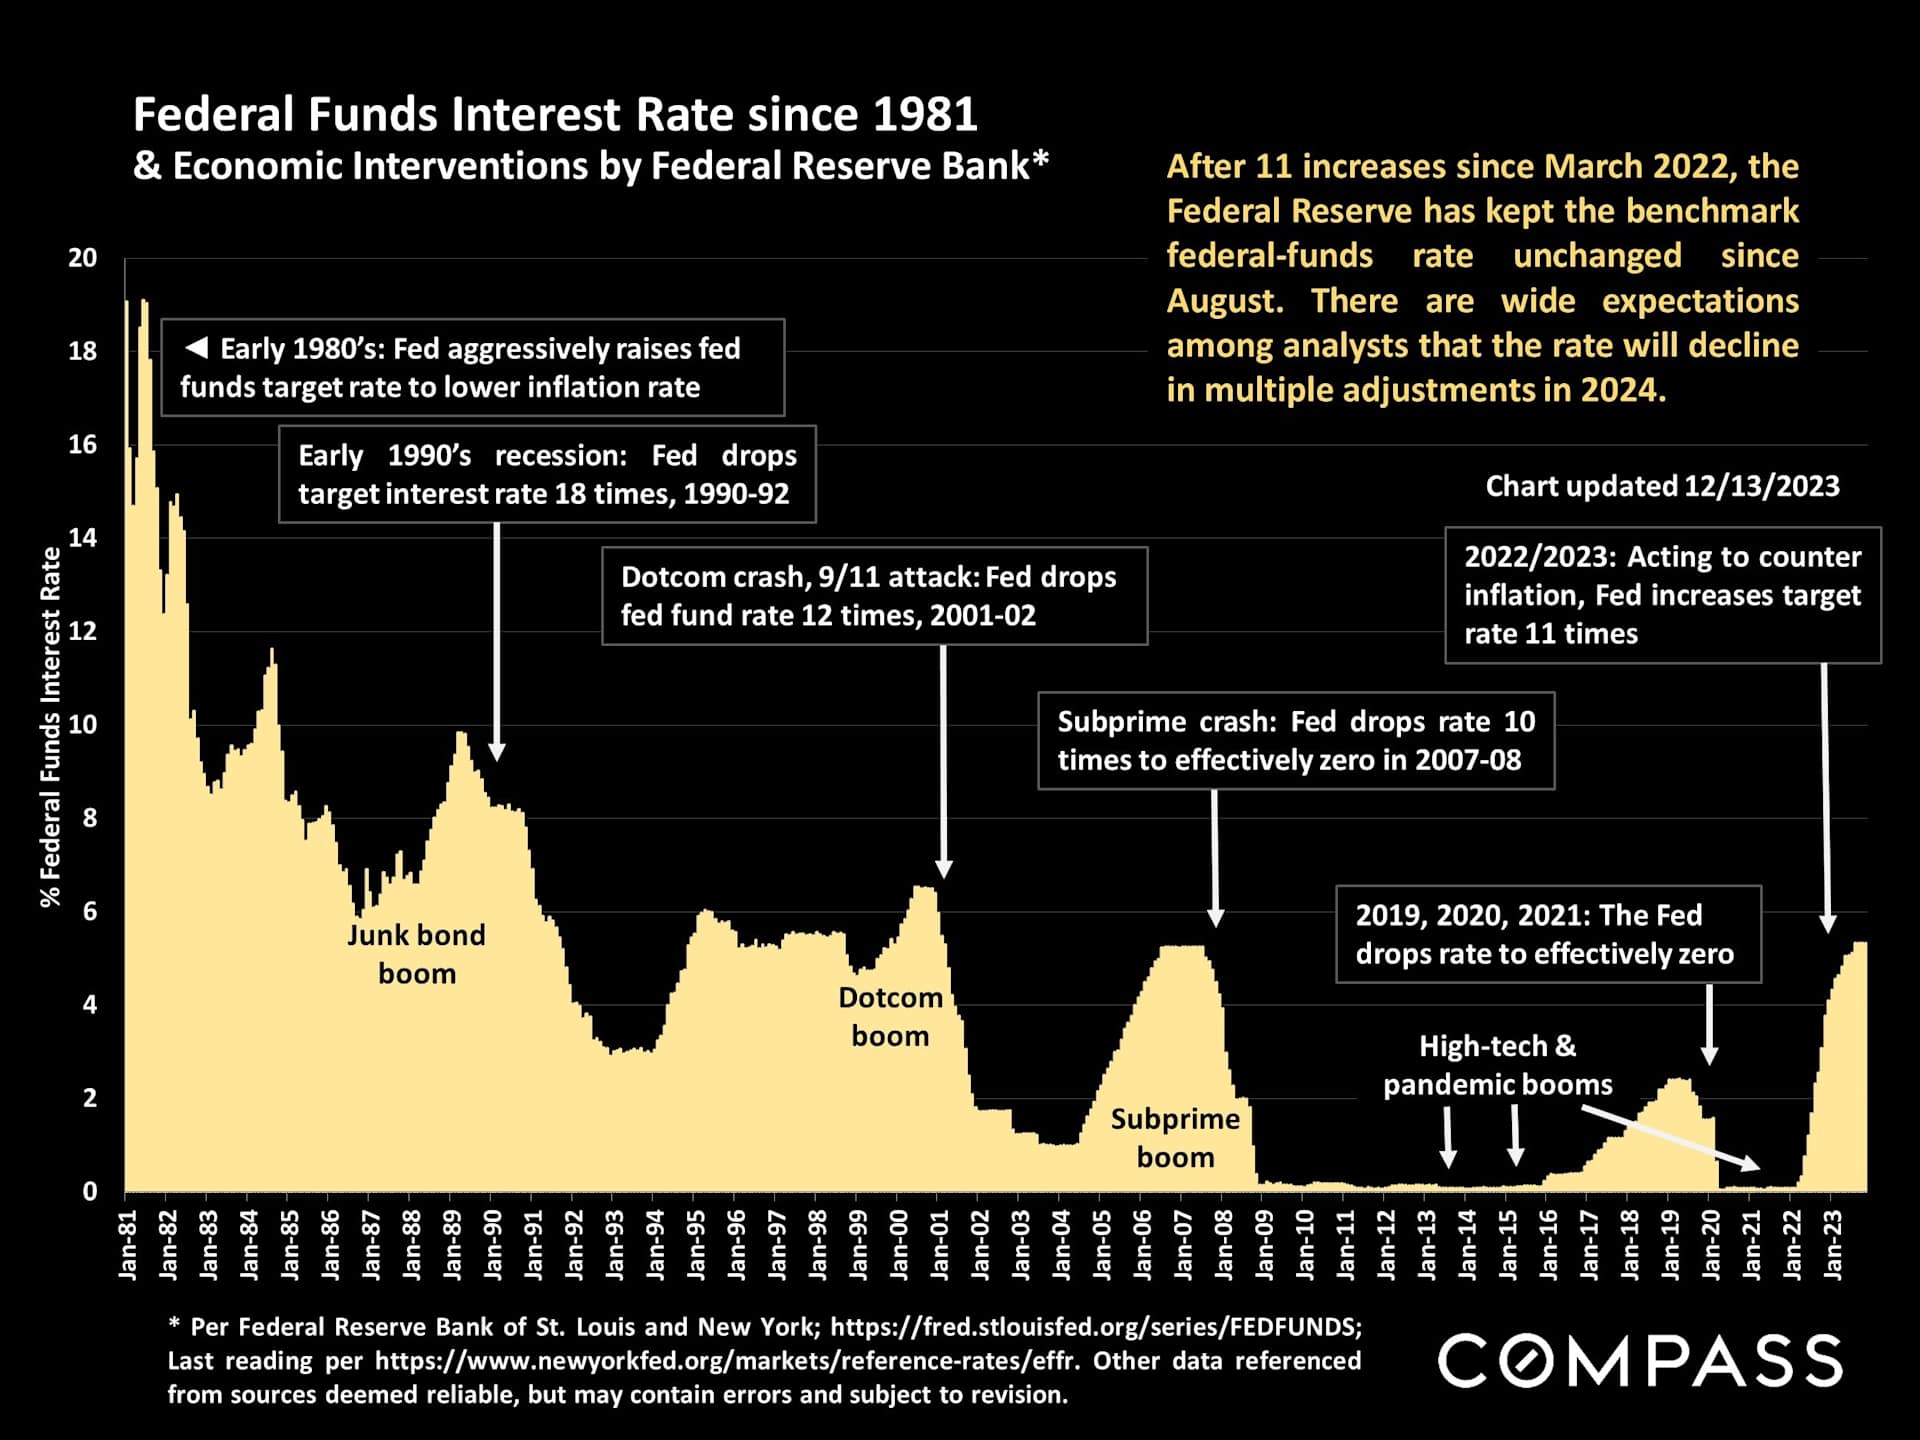
Chart of federal funds interest rates from 1981 to 2023, annotated with major economic events and Federal Reserve actions.

Rarely have stock markets swung so dramatically from pessimism regarding economic trends to ebullient optimism as in the last 2 months of 2023.
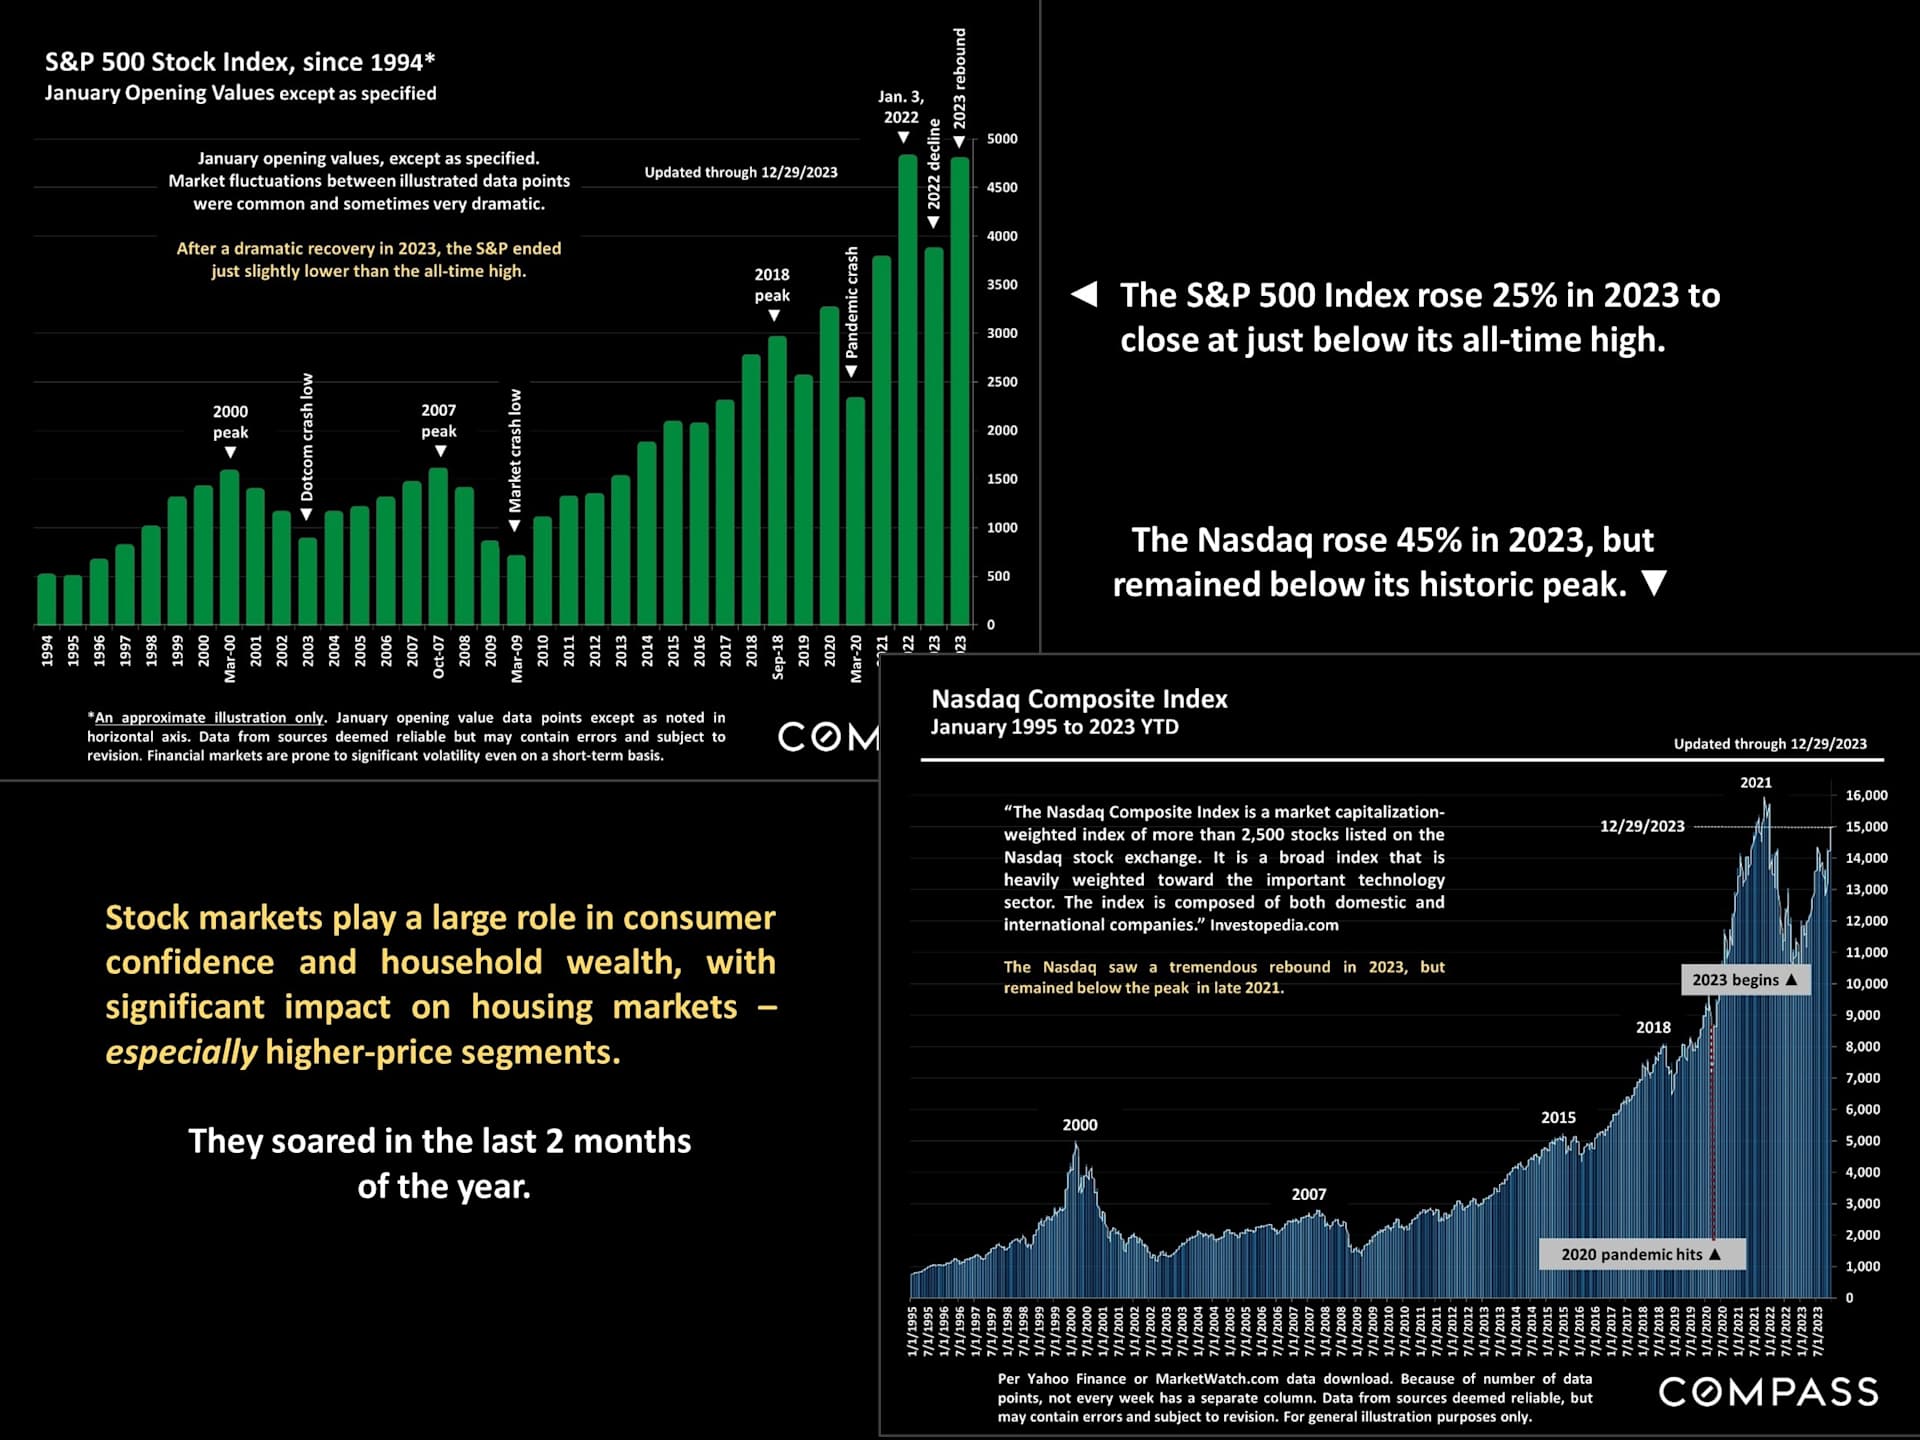
Infographic charts S&P 500 and Nasdaq trends through 2023, with notes on market gains and housing-market impacts.

The effect of high interest rates on the number of new listings coming on market has had a staggering impact on supply & demand dynamics.
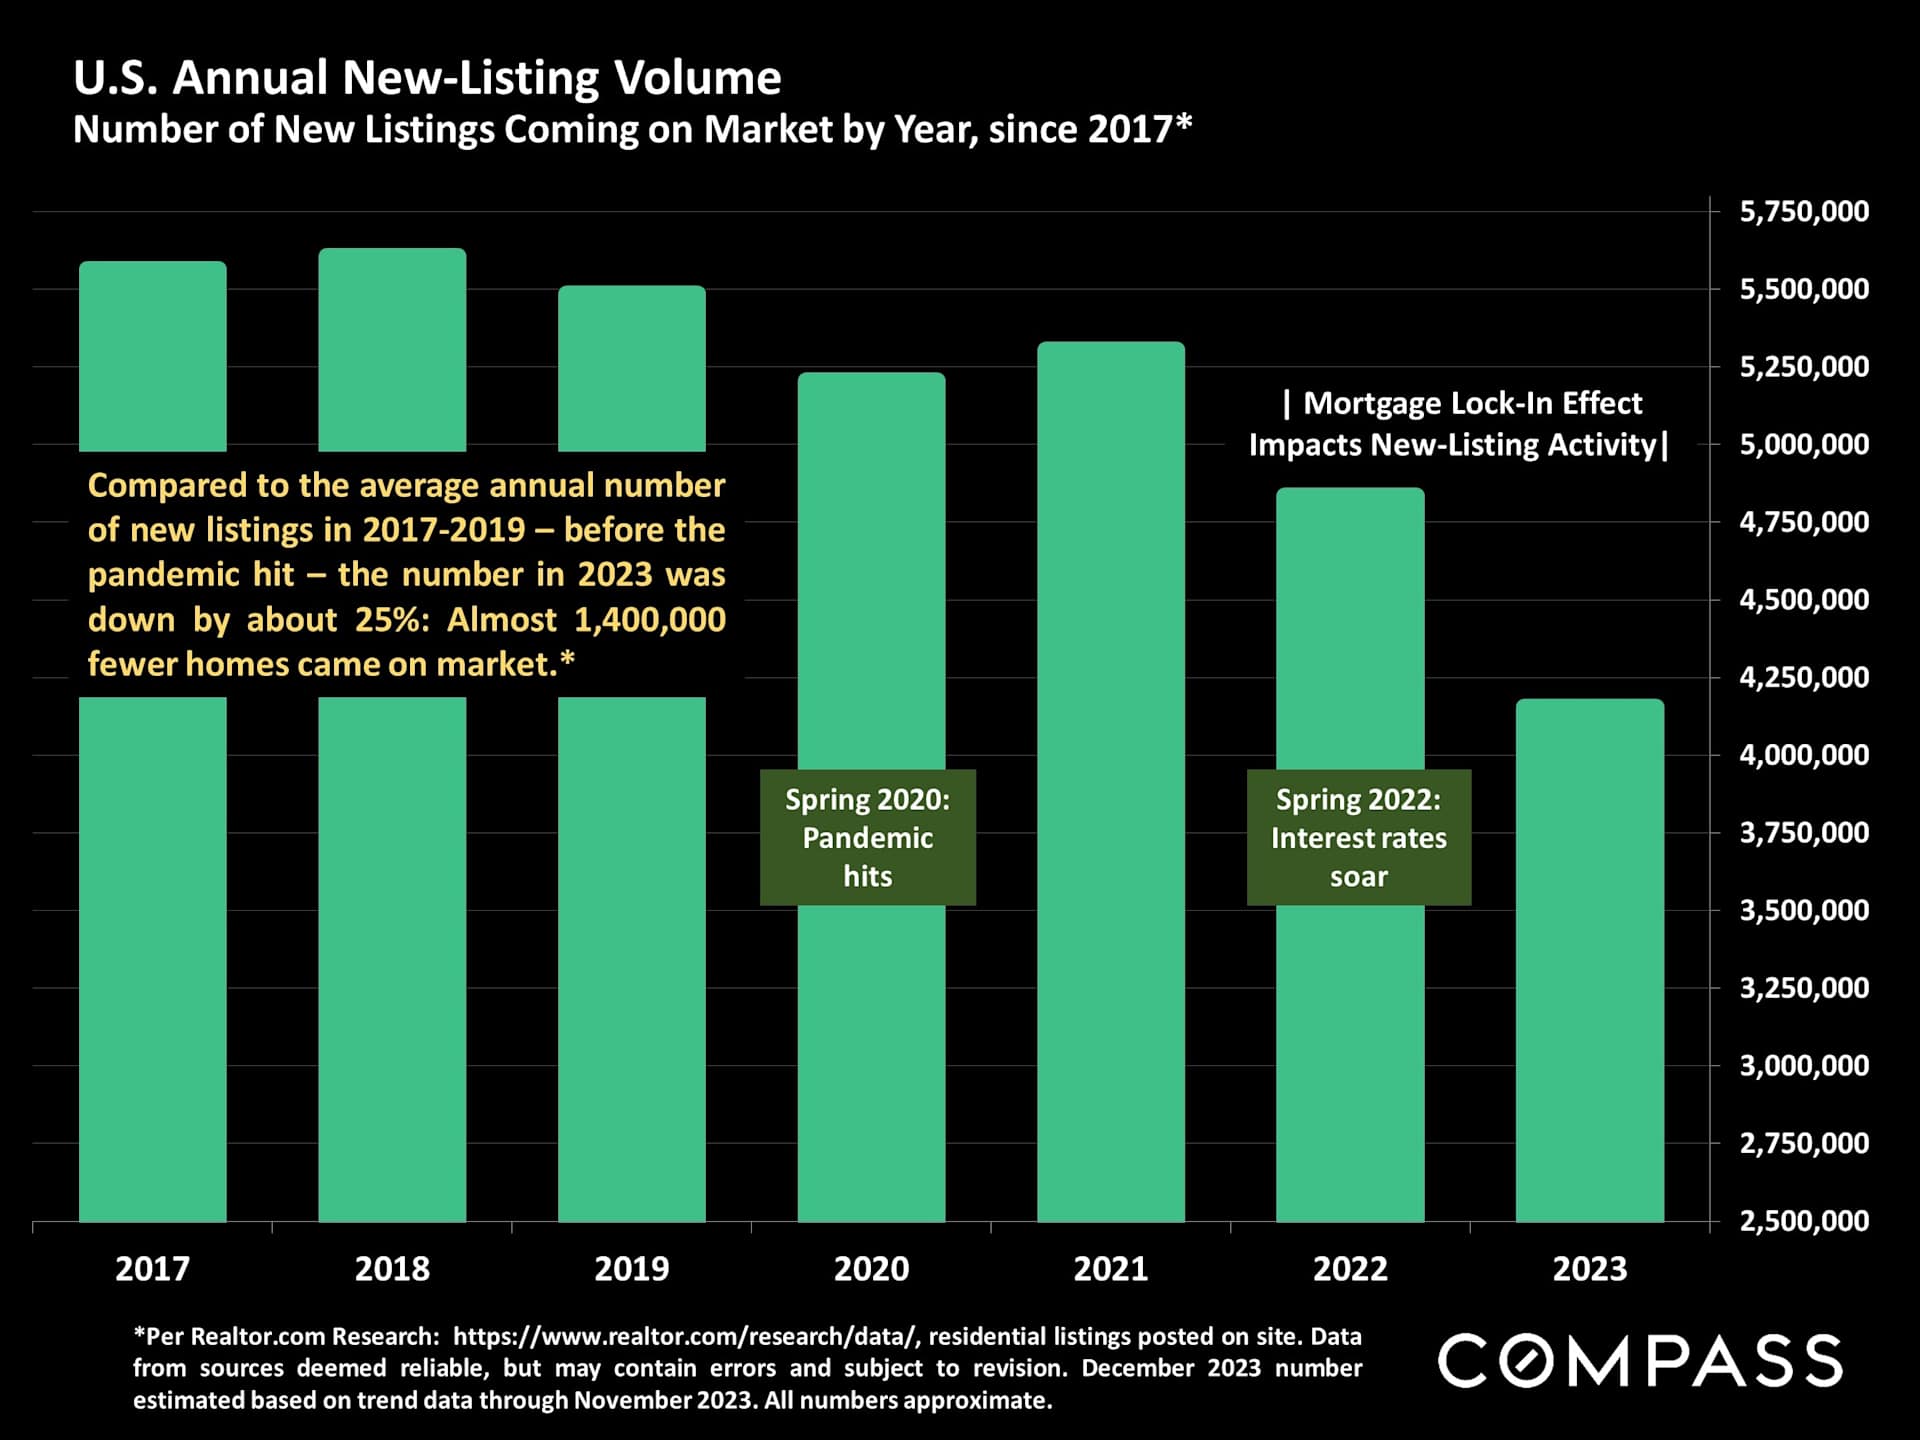
Chart of U.S. annual new listings, showing a 25% decline in 2023 versus the 2017–2019 average.

Even as rising interest rates negatively affected affordability, the extremely low supply of homes for sale has maintained upward pressure on home prices.
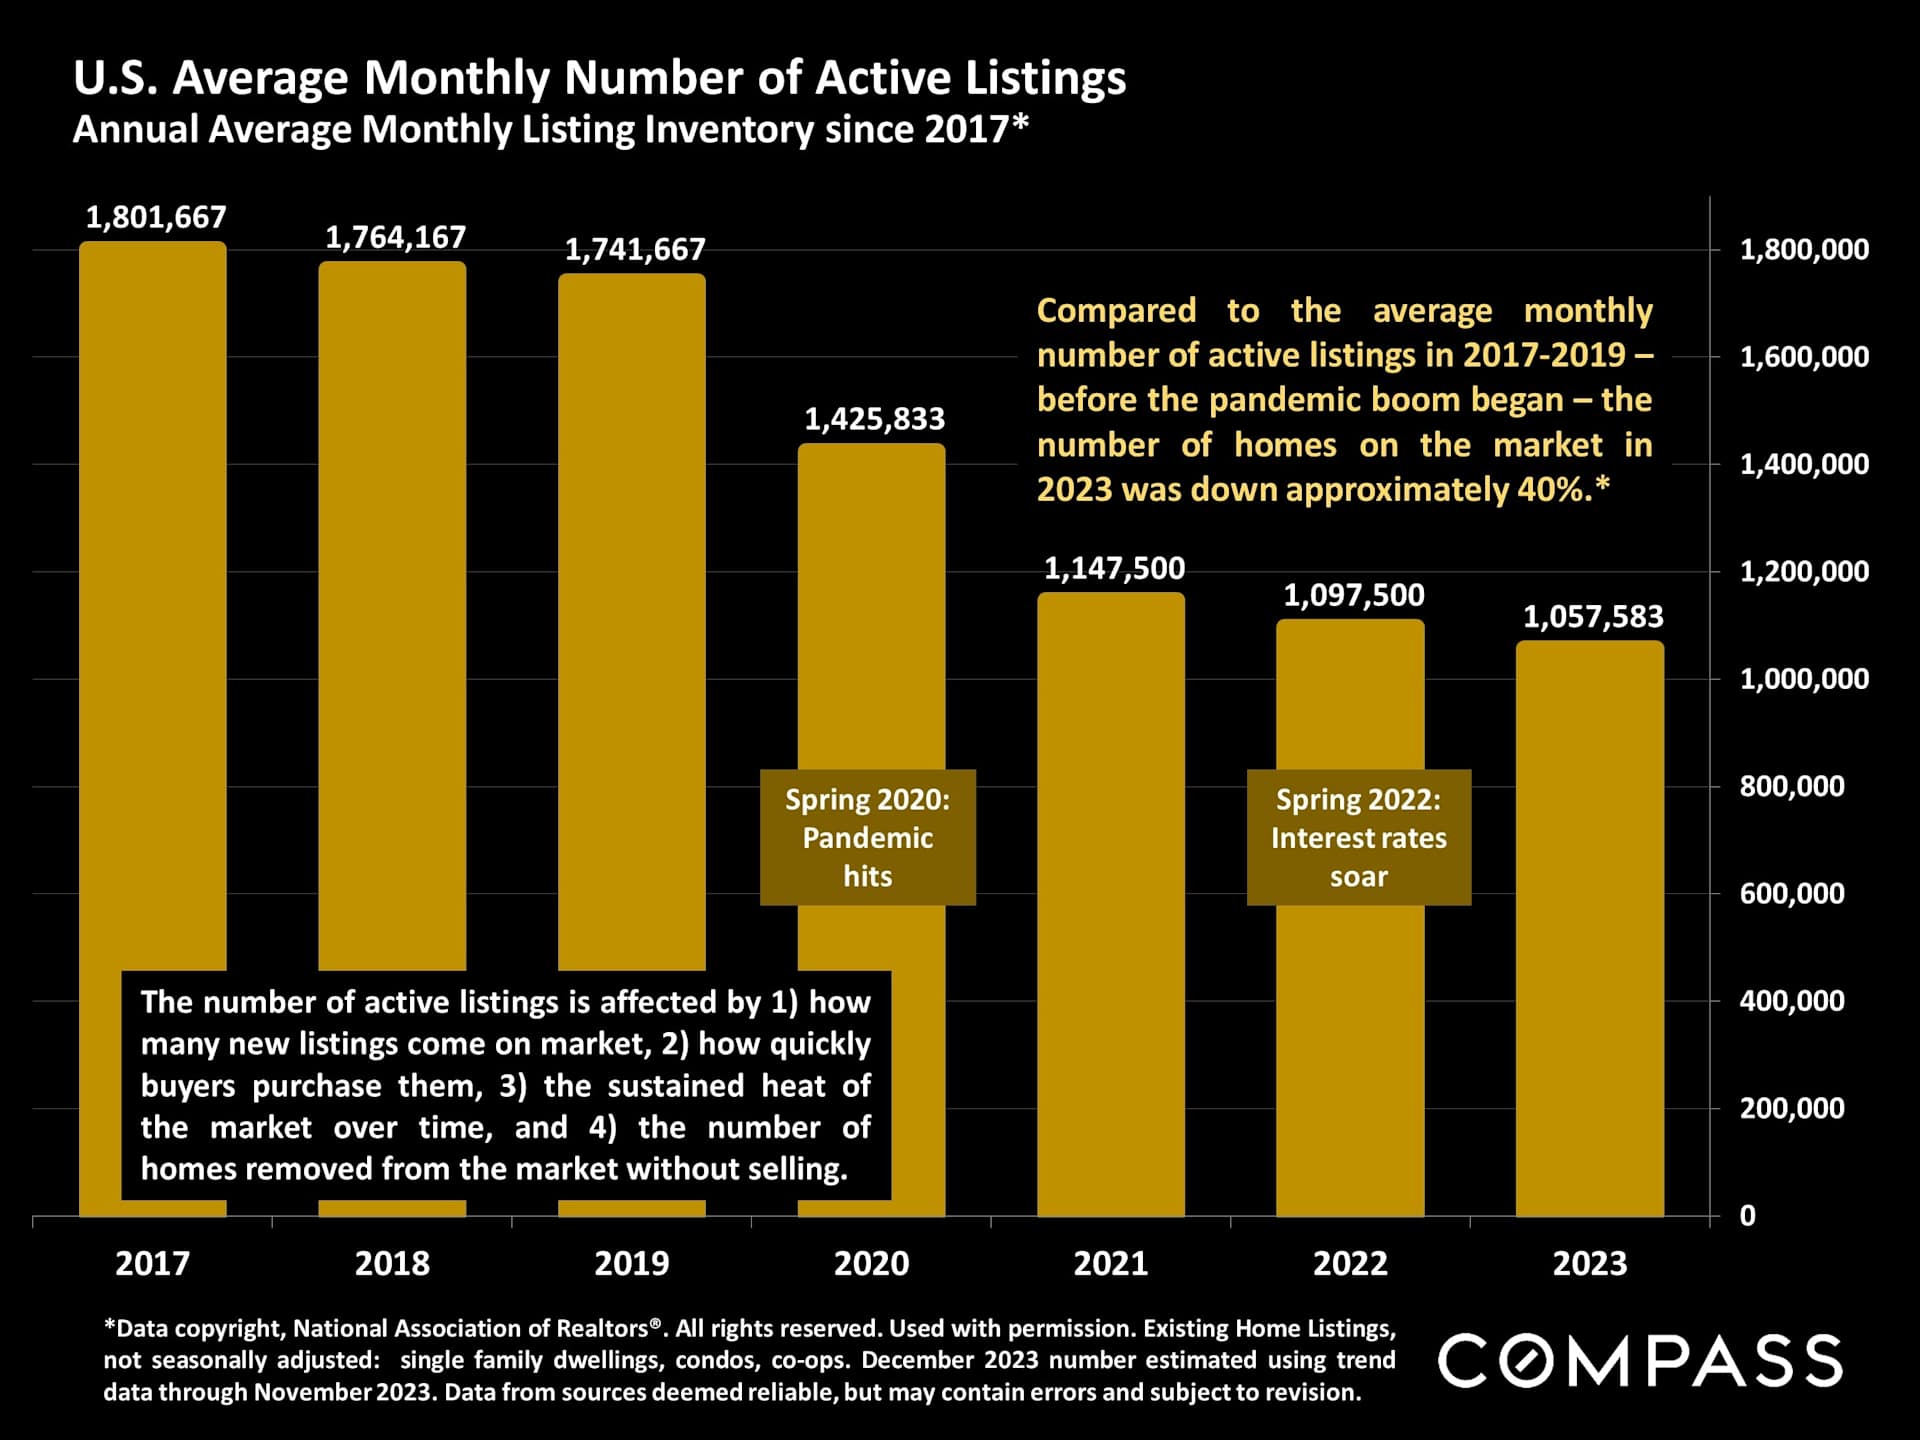
Bar chart of average monthly active listings from 2017 to 2023, showing a decline to about 1.06 million in 2023.

Home sales plunged in 2023, but if economic conditions continue to improve as currently forecast, both supply and demand should rise in 2024.
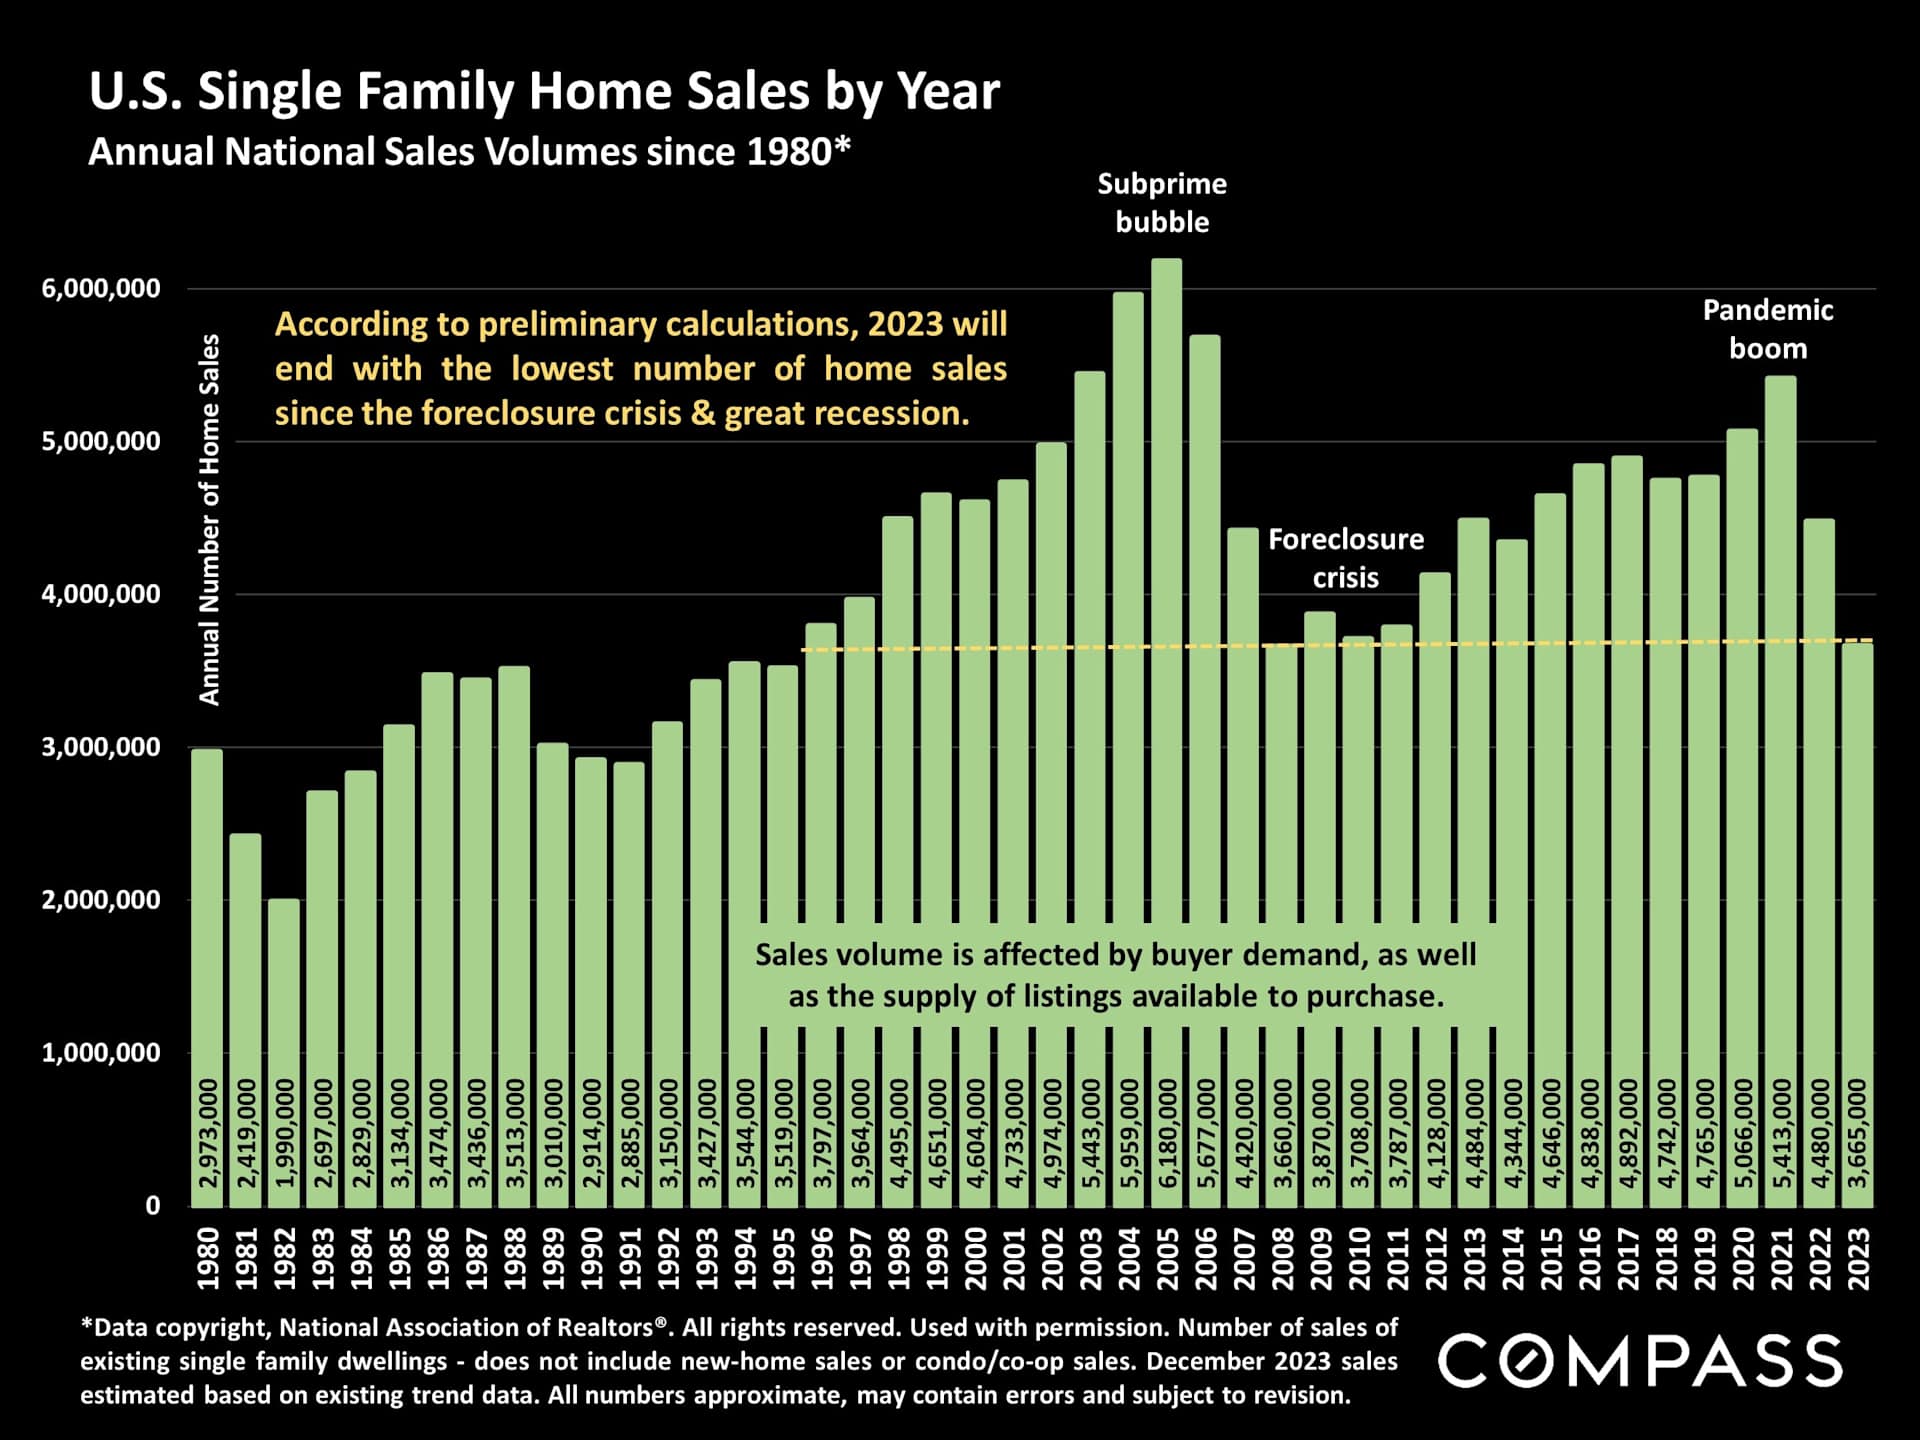
Bar chart of U.S. single-family home sales from 1980 to 2023, with peaks labeled for the subprime bubble and pandemic boom.

Monthly accepted-offer activity, seen below, highlights the effects of market seasonality. Activity usually picks up rapidly in the 1st quarter to peak in spring.
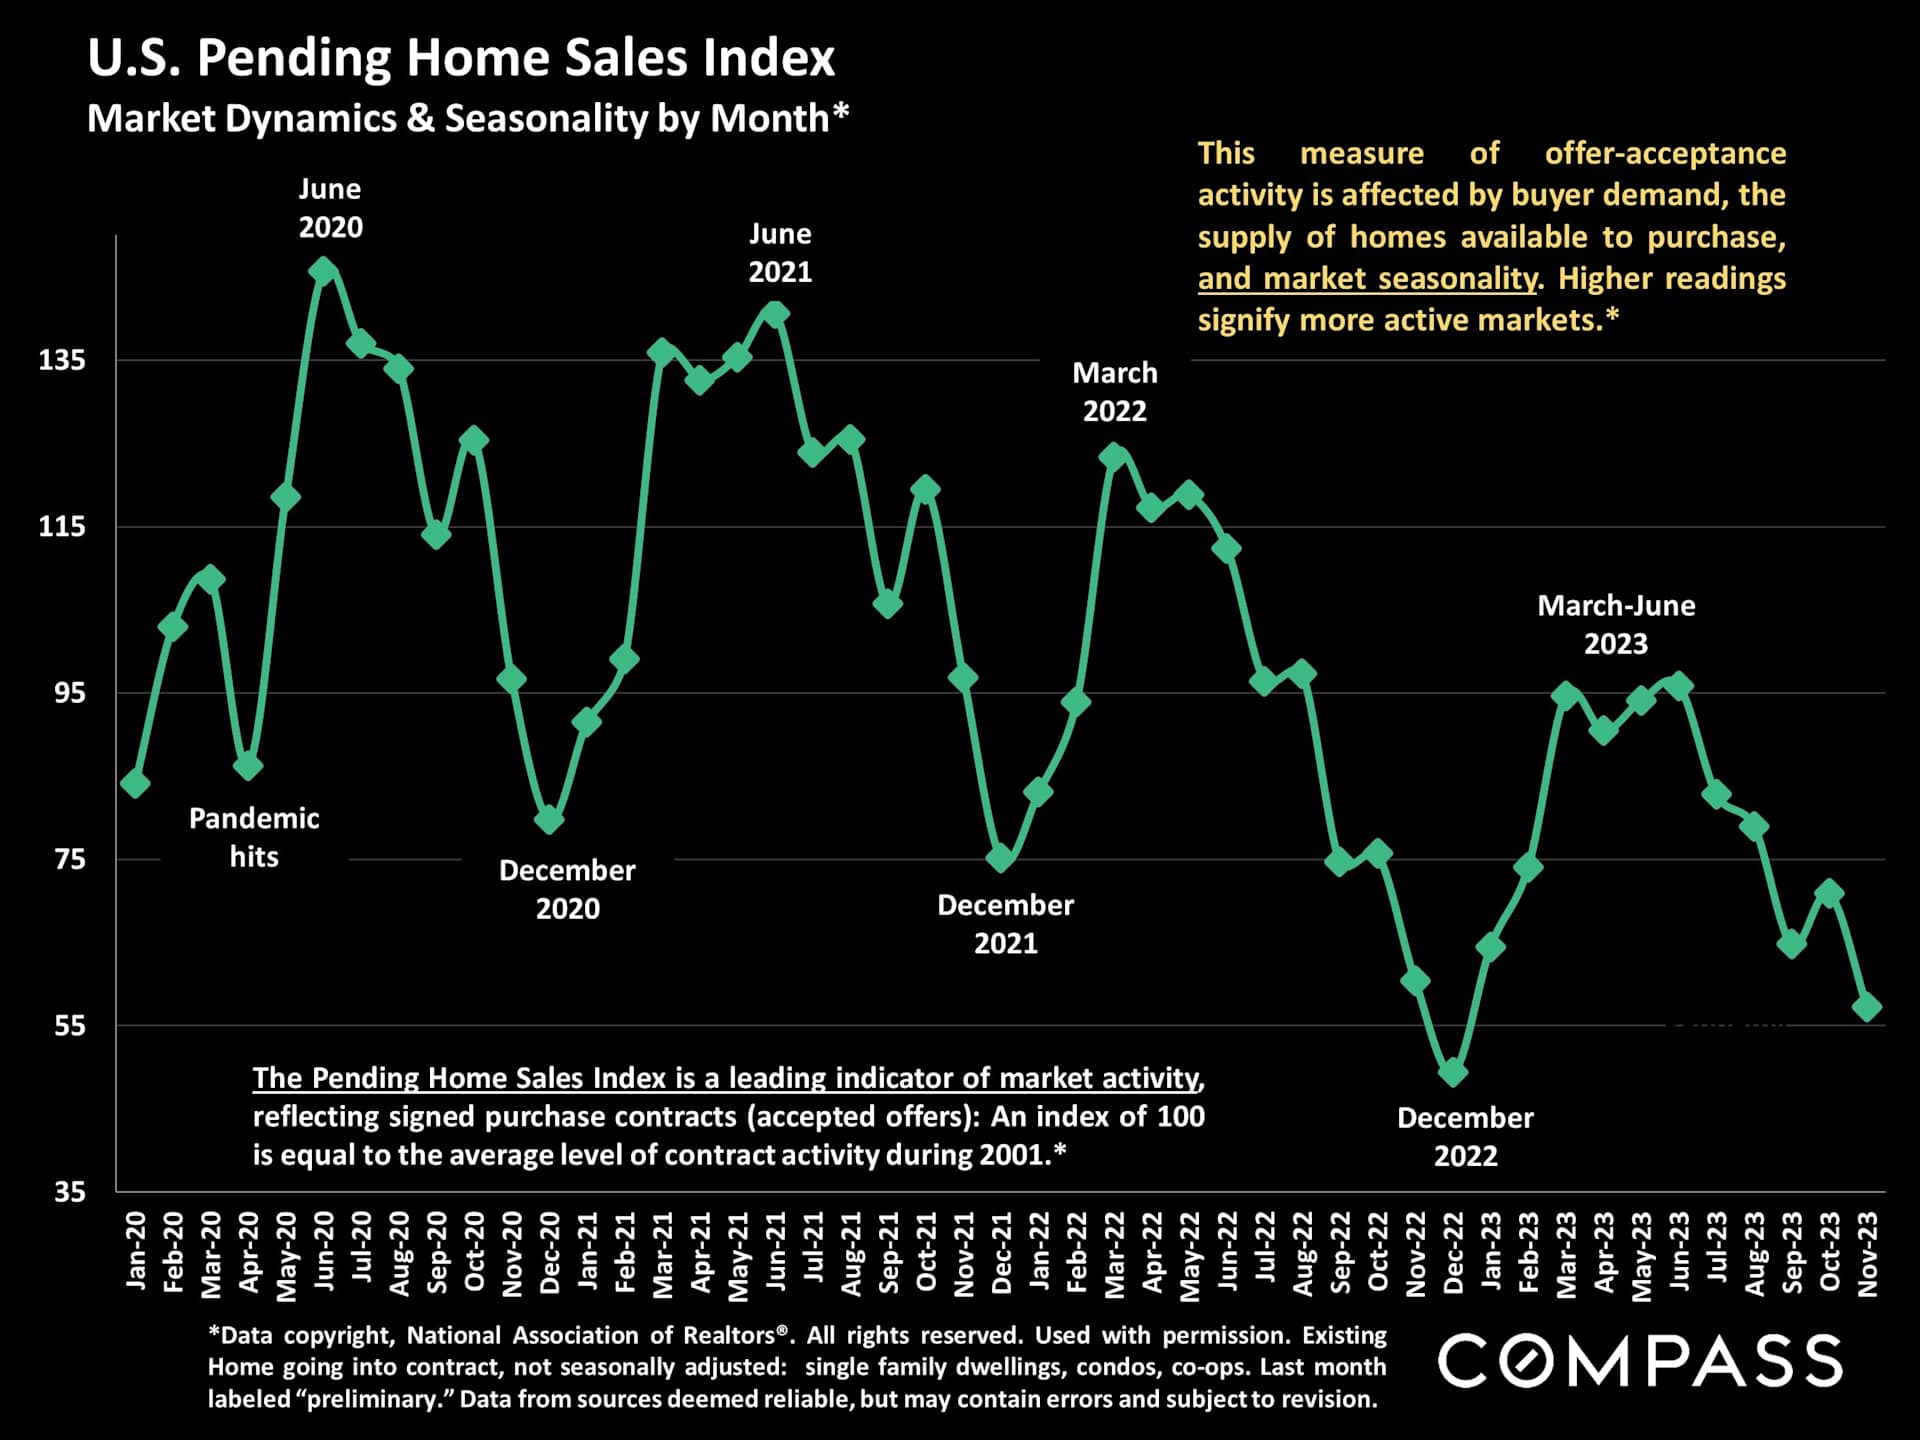
U.S. Pending Home Sales Index chart, showing monthly activity from 2020 to 2023 and a December 2022 low.

A long-term illustration of national median house sales prices - which defying expectations, saw a strong recovery in 2023 after the mid-2022 plunge.
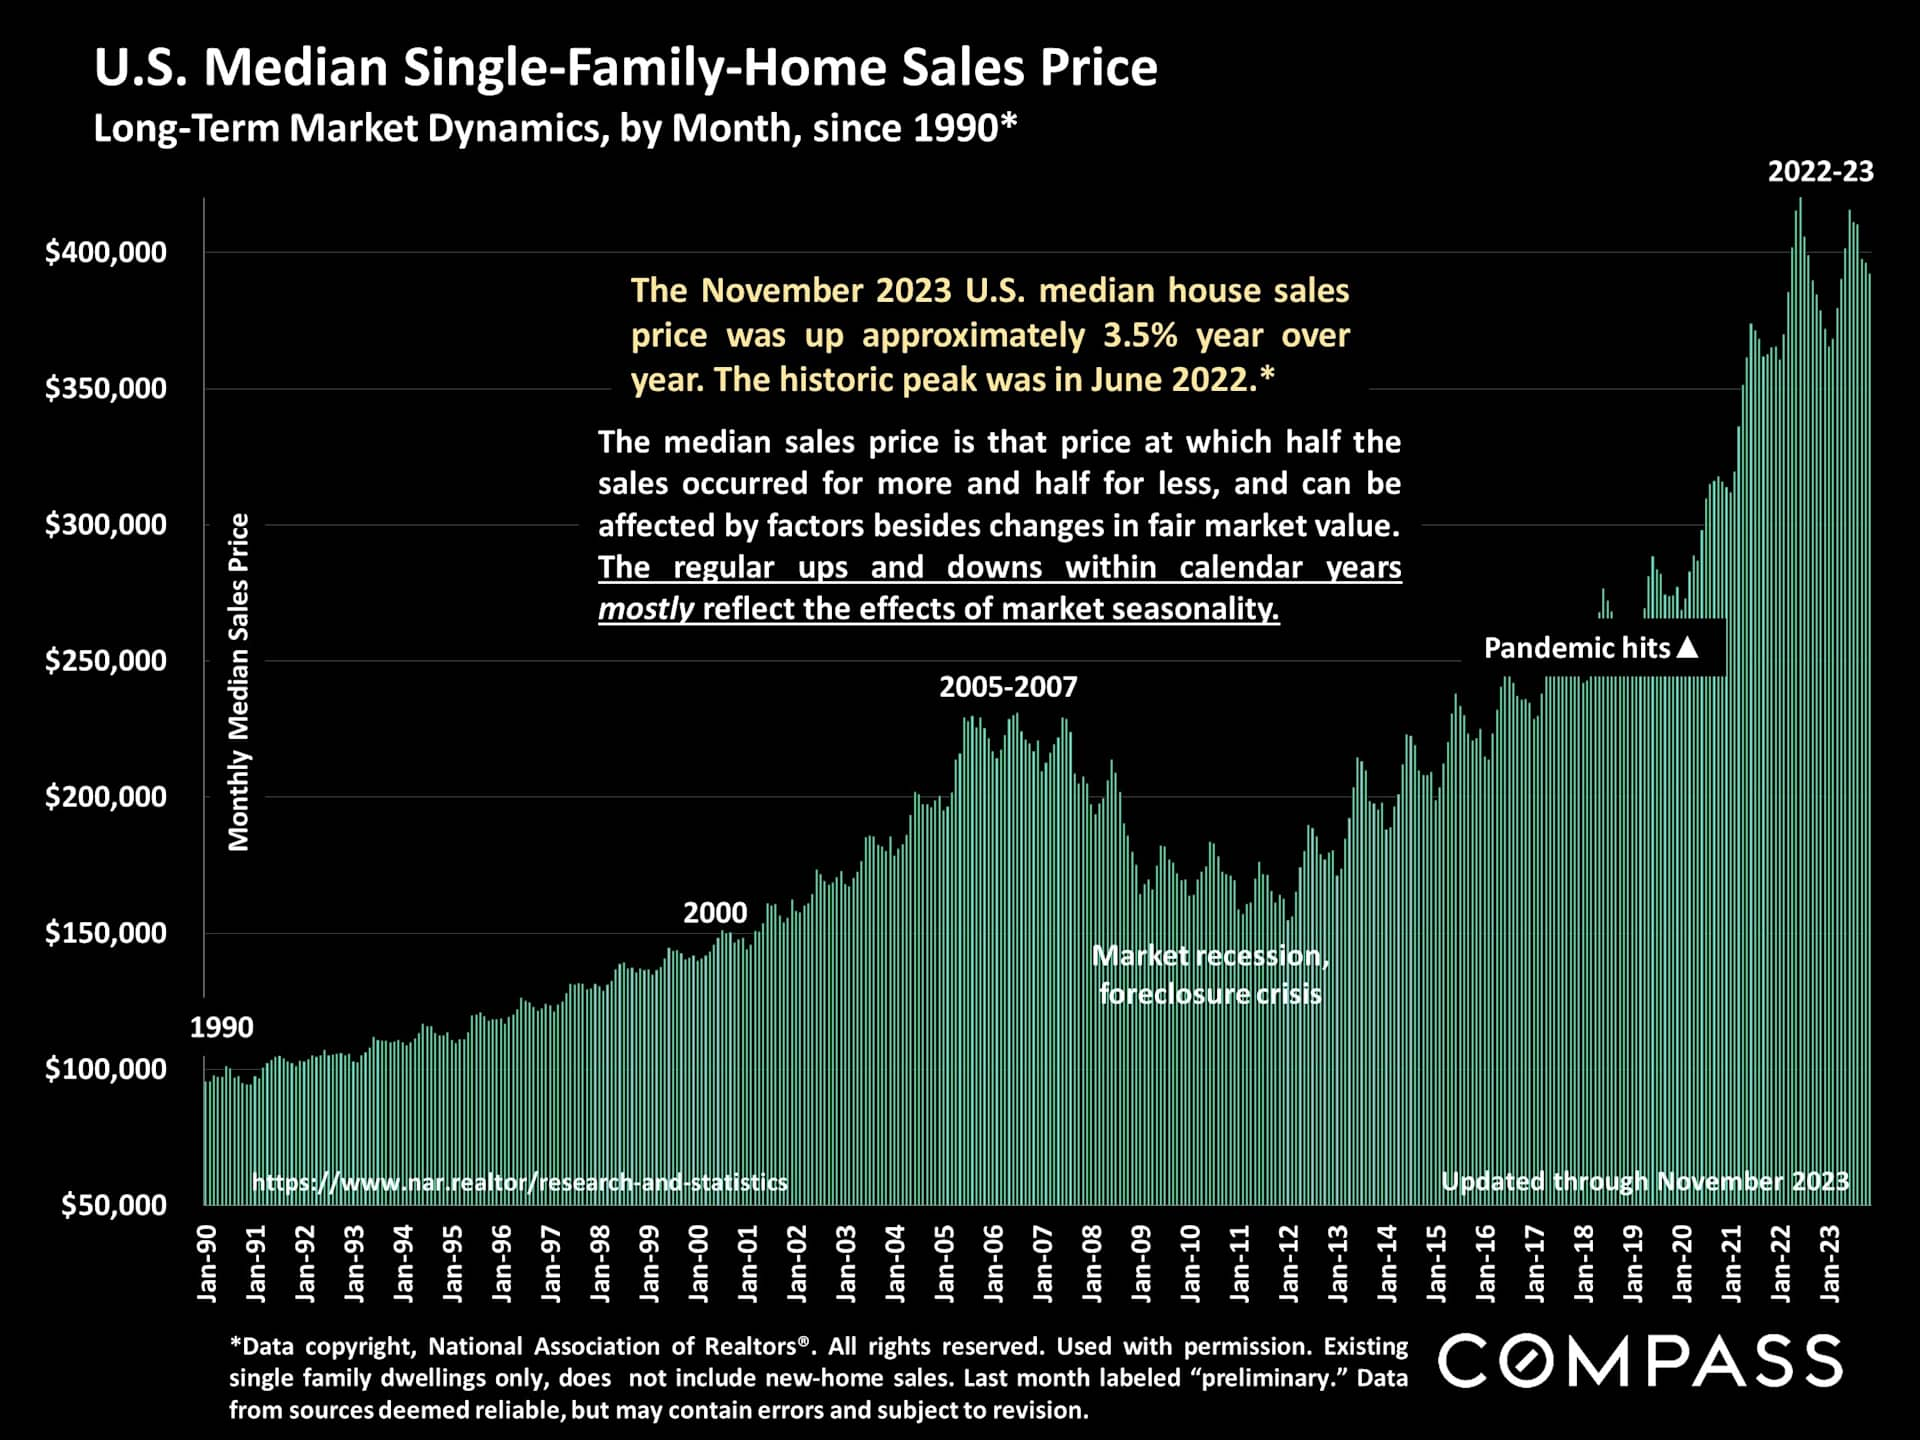
Chart of U.S. median single-family home prices, 1990–2023, highlighting the 2022 peak and November 2023 increase.

Across all national regions, there has been very substantial

home price appreciation over the past 5 years.
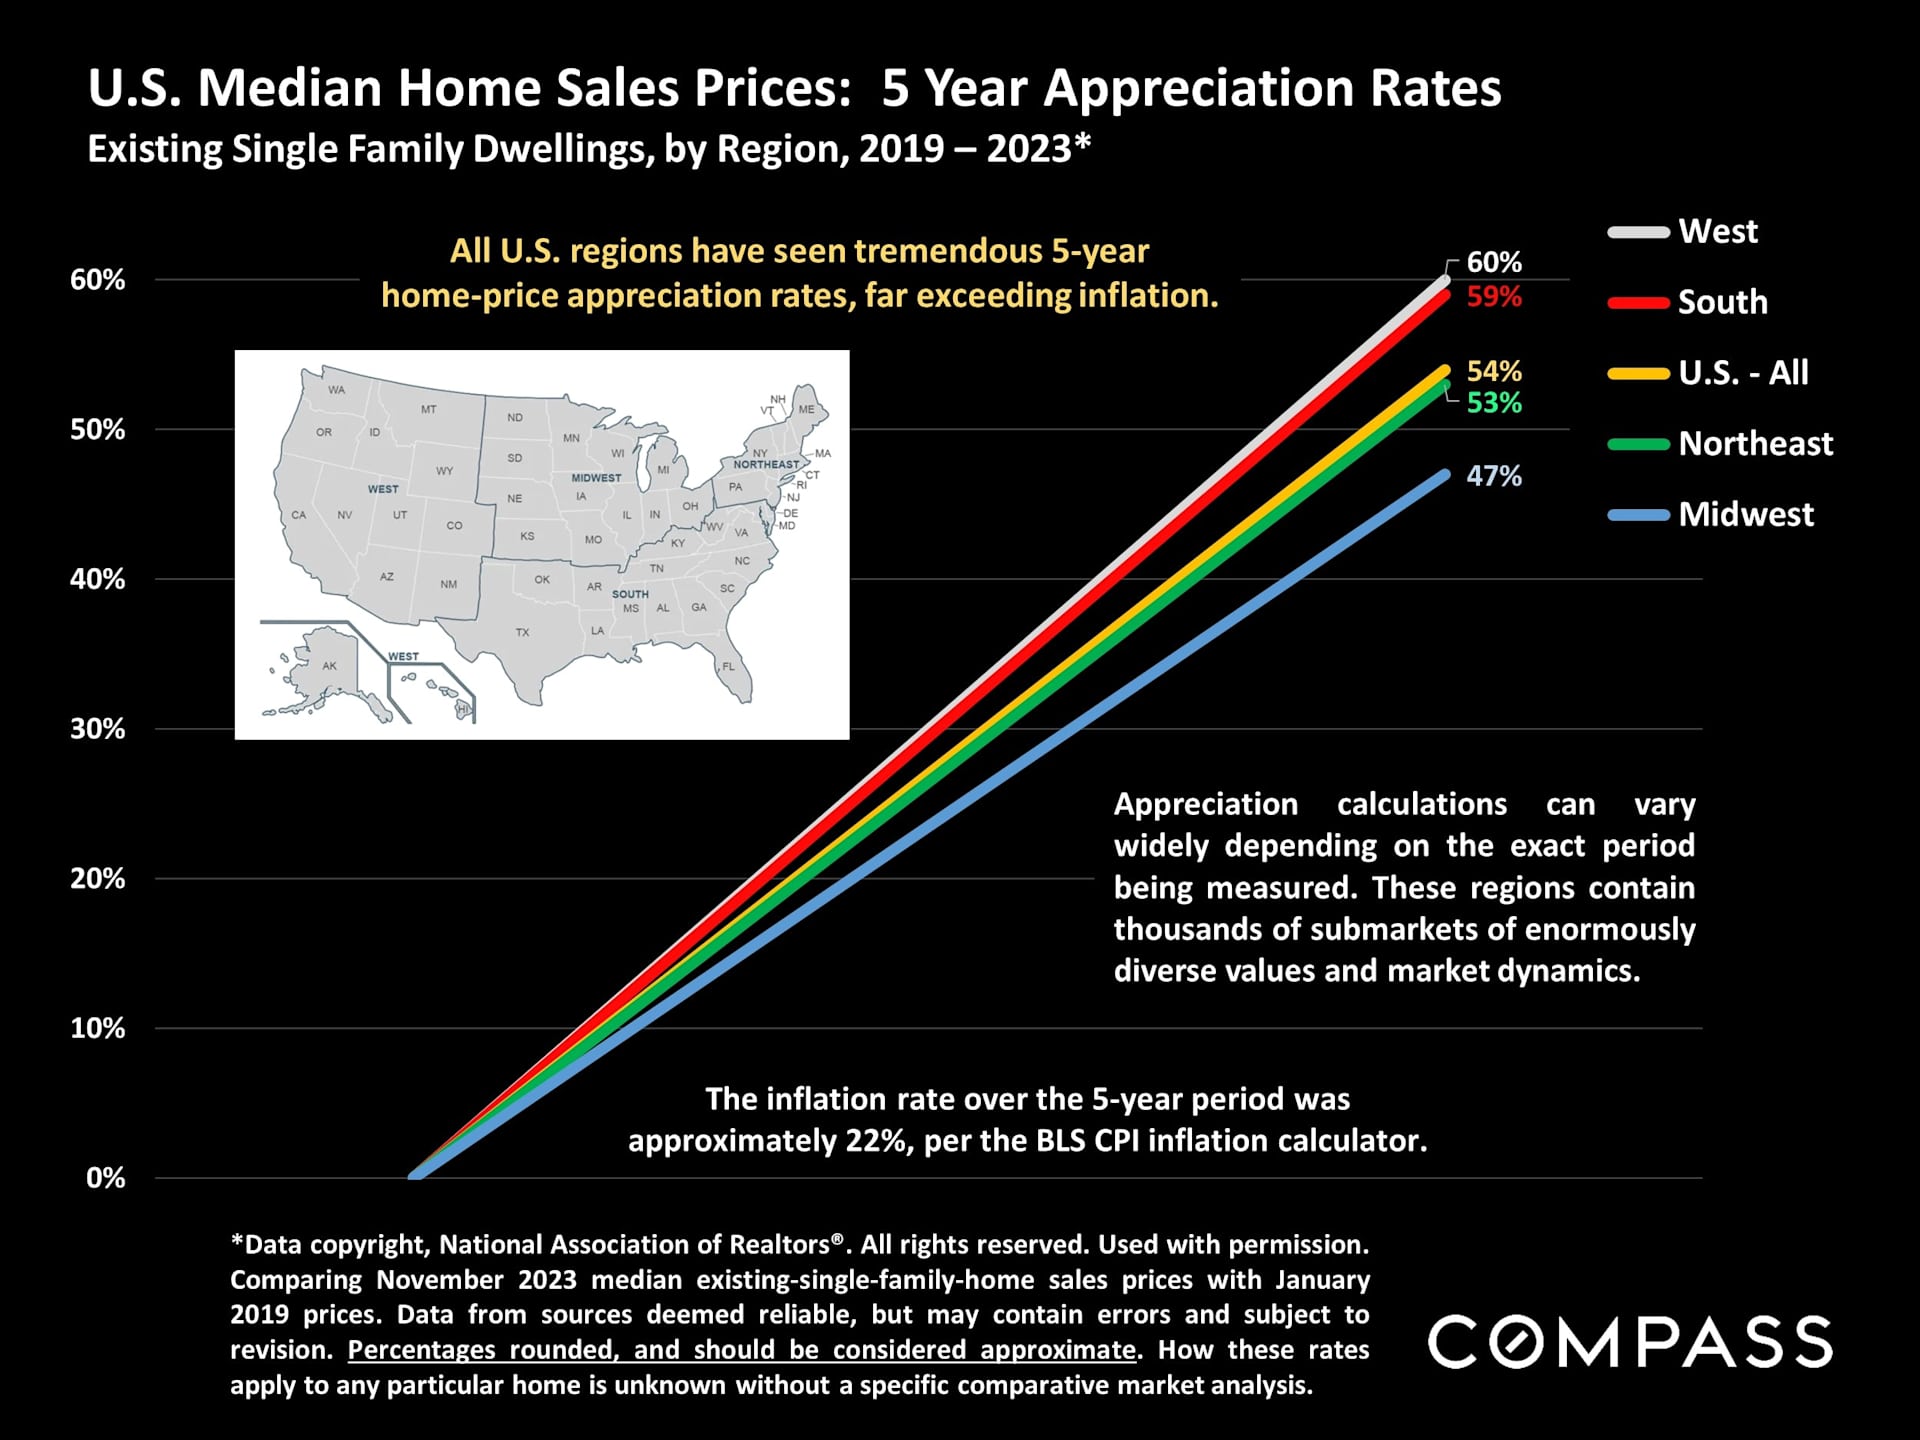
Chart of five-year U.S. home price appreciation by region: West 60%, South 59%, U.S. 54%, Northeast 53%, Midwest 47%.

Speed of sale is mostly determined by the intensity of buyer demand as compared to supply. Median days on market remain very low by long-term standards.
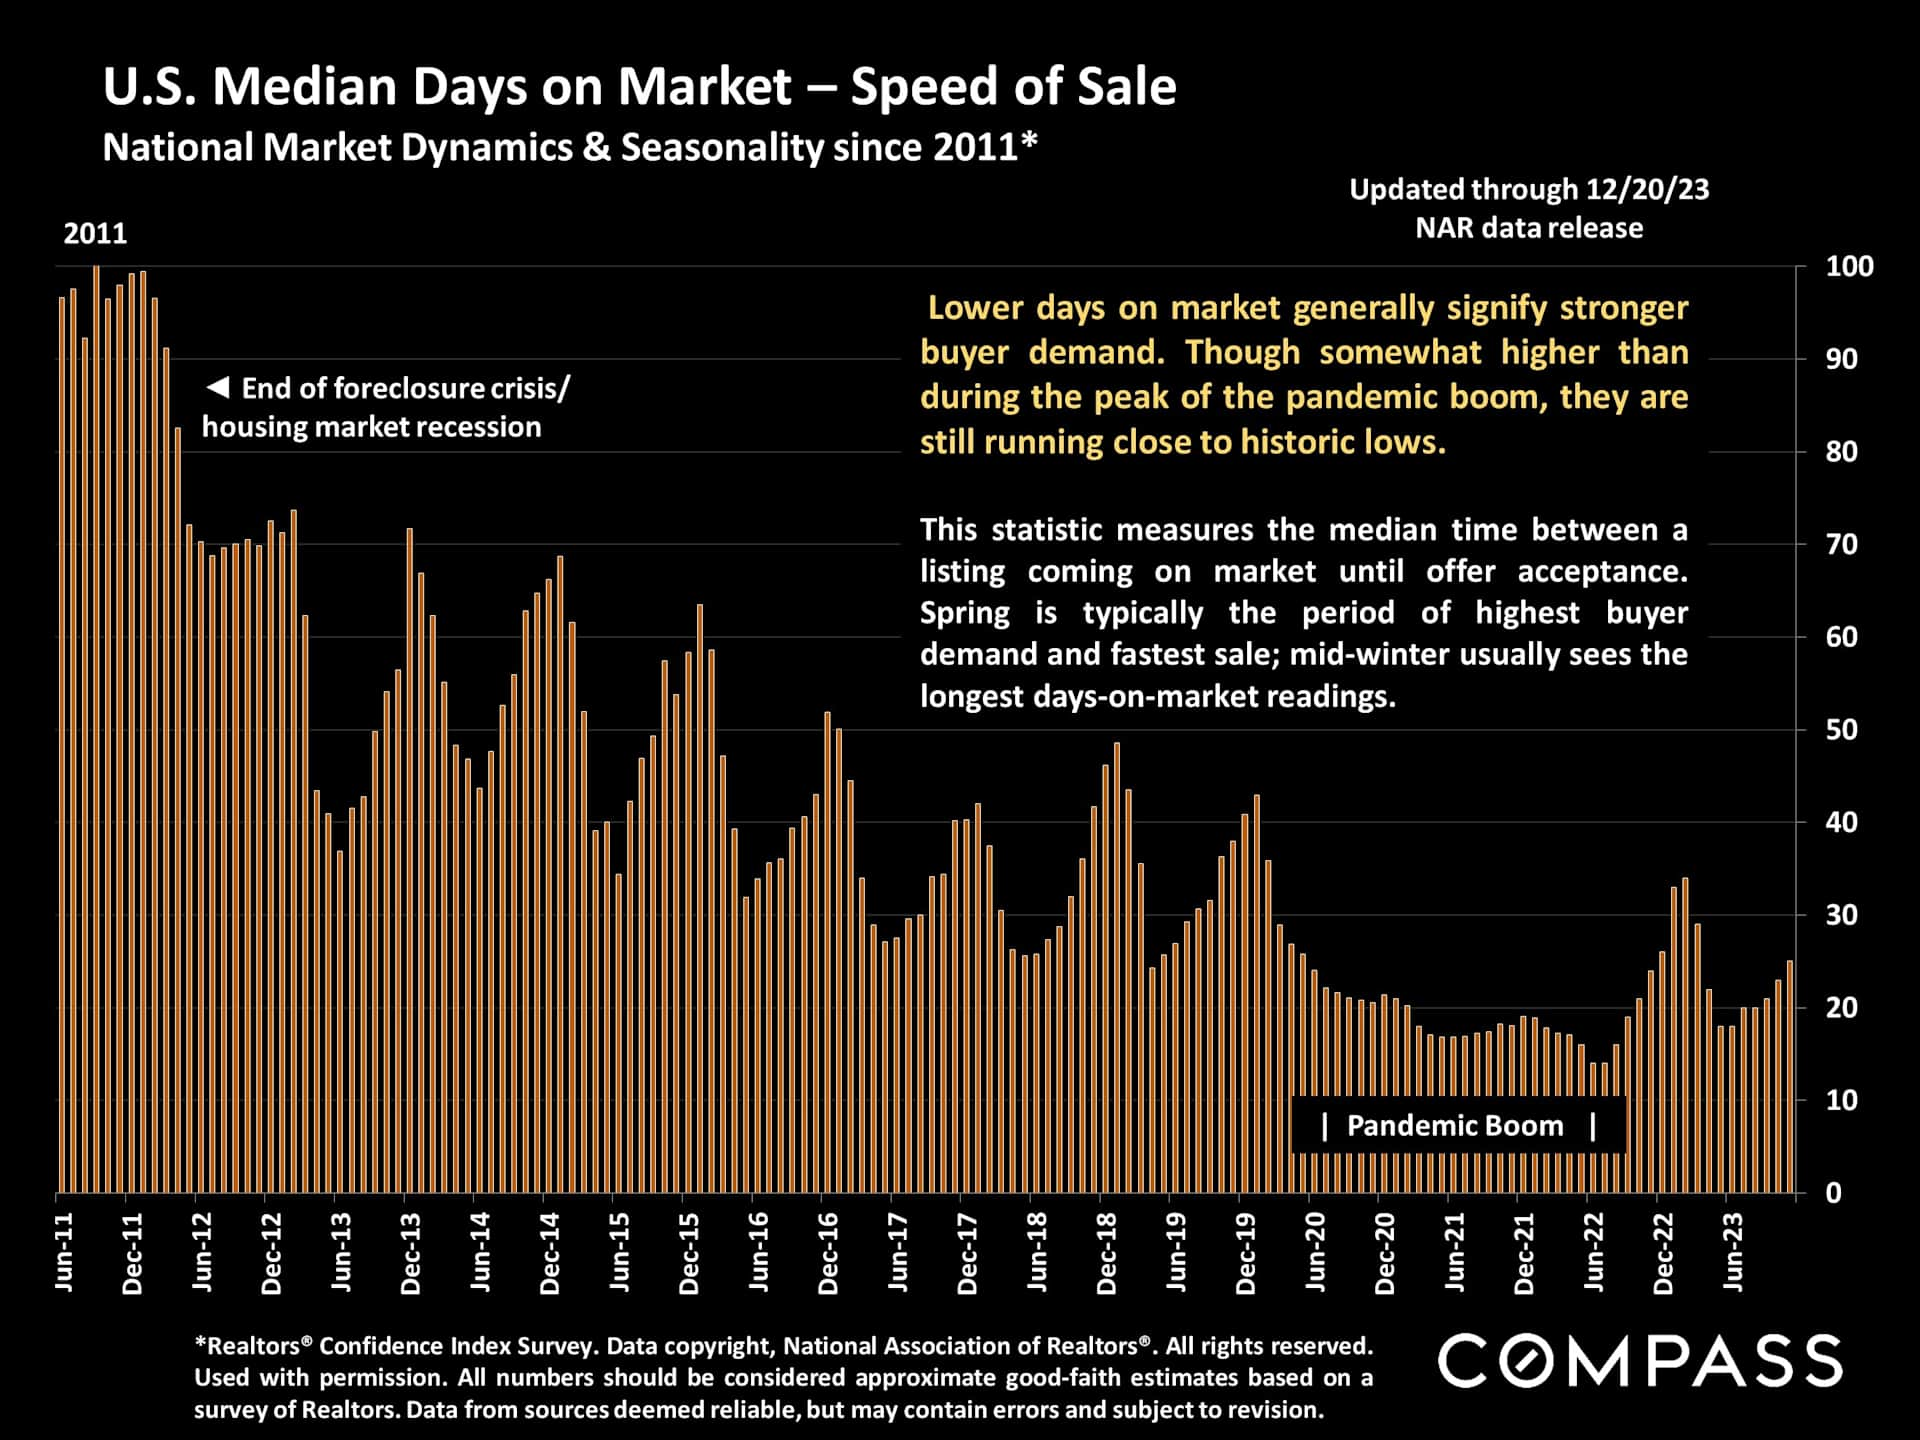
Chart of U.S. median days on market from 2011 to 2023, with historic lows during the pandemic boom.

As interest rates rose, so did the percentage of all-cash buyers - who have played an increasing role in supporting demand and home prices.
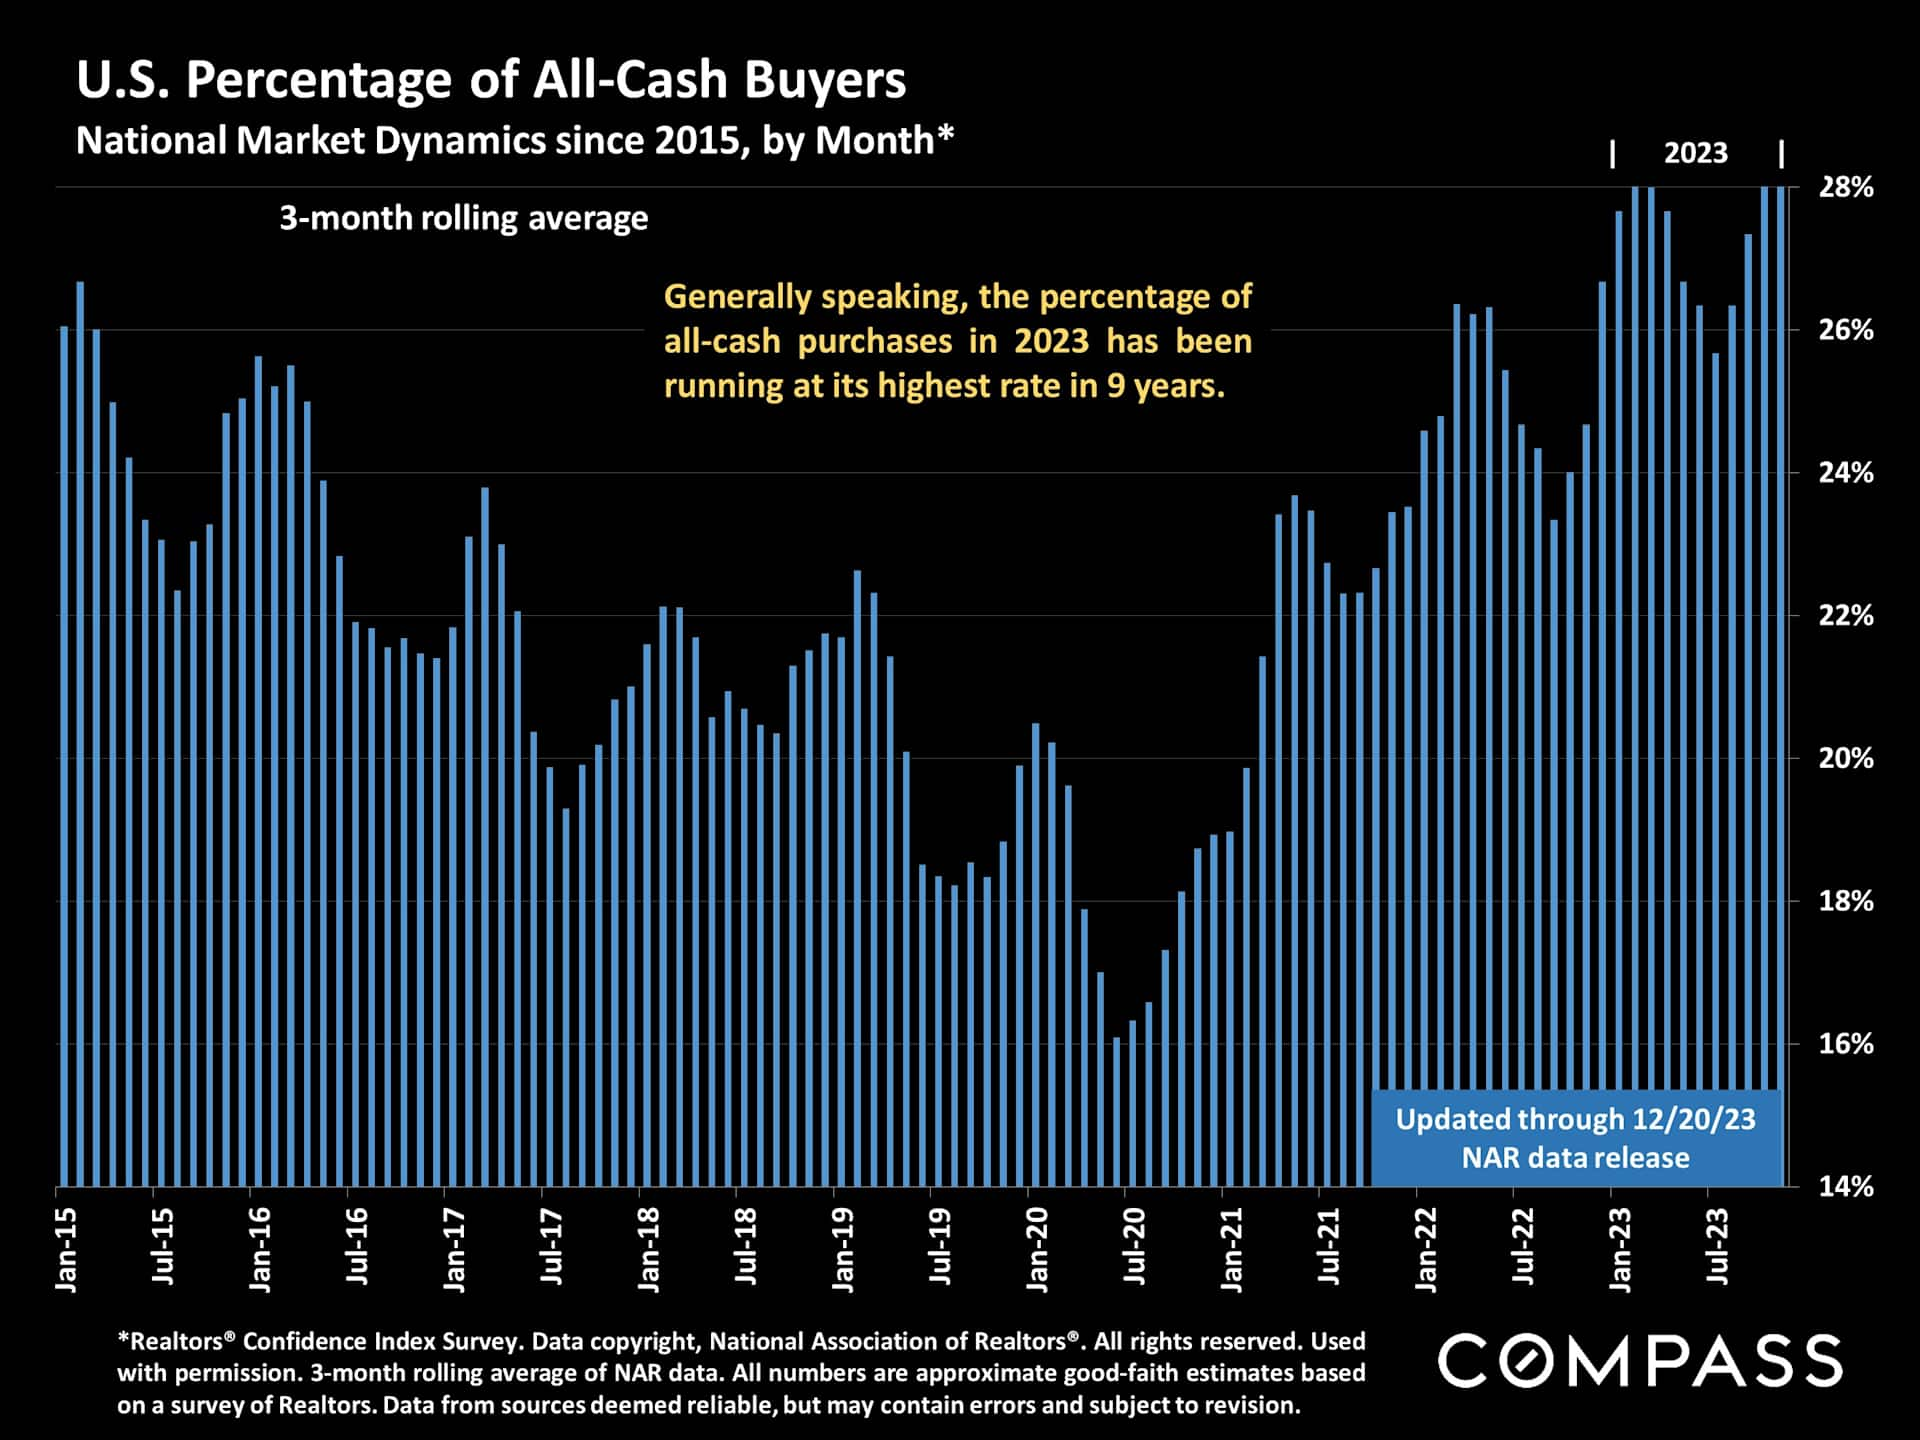
Bar chart of U.S. all-cash home buyers, with the share nearing 28% in 2023.

Let's talk more about the potential for property appreciation and the stability of the local real estate market in Montecito for 2024. Wishing you and yours a safe, happy, healthy and prosperous 2024!


Work With Us

The Morehart Group has set a standard of excellence in the Santa Barbara and Montecito luxury real estate market. Offering a unique combination of local insight, unmatched experience, and global expertise, the group has a history of cultivating strong relationships within the local community.

Follow Us on Instagram